> ## Documentation Index
> Fetch the complete documentation index at: https://docs.open-metadata.org/llms.txt
> Use this file to discover all available pages before exploring further.
# Usage Workflow Guide | OpenMetadata Ingestion Workflows
> Monitor usage patterns from queries and dashboards with workflow-based usage extraction.
export const connector_0 = "bigquery"
# Usage Workflow
Learn how to configure the Usage workflow from the UI to ingest Query history data from your data sources.
This workflow is available ONLY for the following connectors:
* [BigQuery](/v1.12.x/connectors/database/bigquery)
* [Snowflake](/v1.12.x/connectors/database/snowflake)
* [MSSQL](/v1.12.x/connectors/database/mssql)
* [Redshift](/v1.12.x/connectors/database/redshift)
* [Clickhouse](/v1.12.x/connectors/database/clickhouse)
* [PostgreSQL](/v1.12.x/connectors/database/postgres)
* [Databricks](/v1.12.x/connectors/database/databricks)
If your database service is not yet supported, you can use this same workflow by providing a Query Log file!
Learn how to do so 👇
Configure the usage workflow by providing a Query Log file.
## UI Configuration
Once the metadata ingestion runs correctly and we are able to explore the service Entities, we can add Query Usage information.
This will populate the Queries tab from the Table Entity Page.
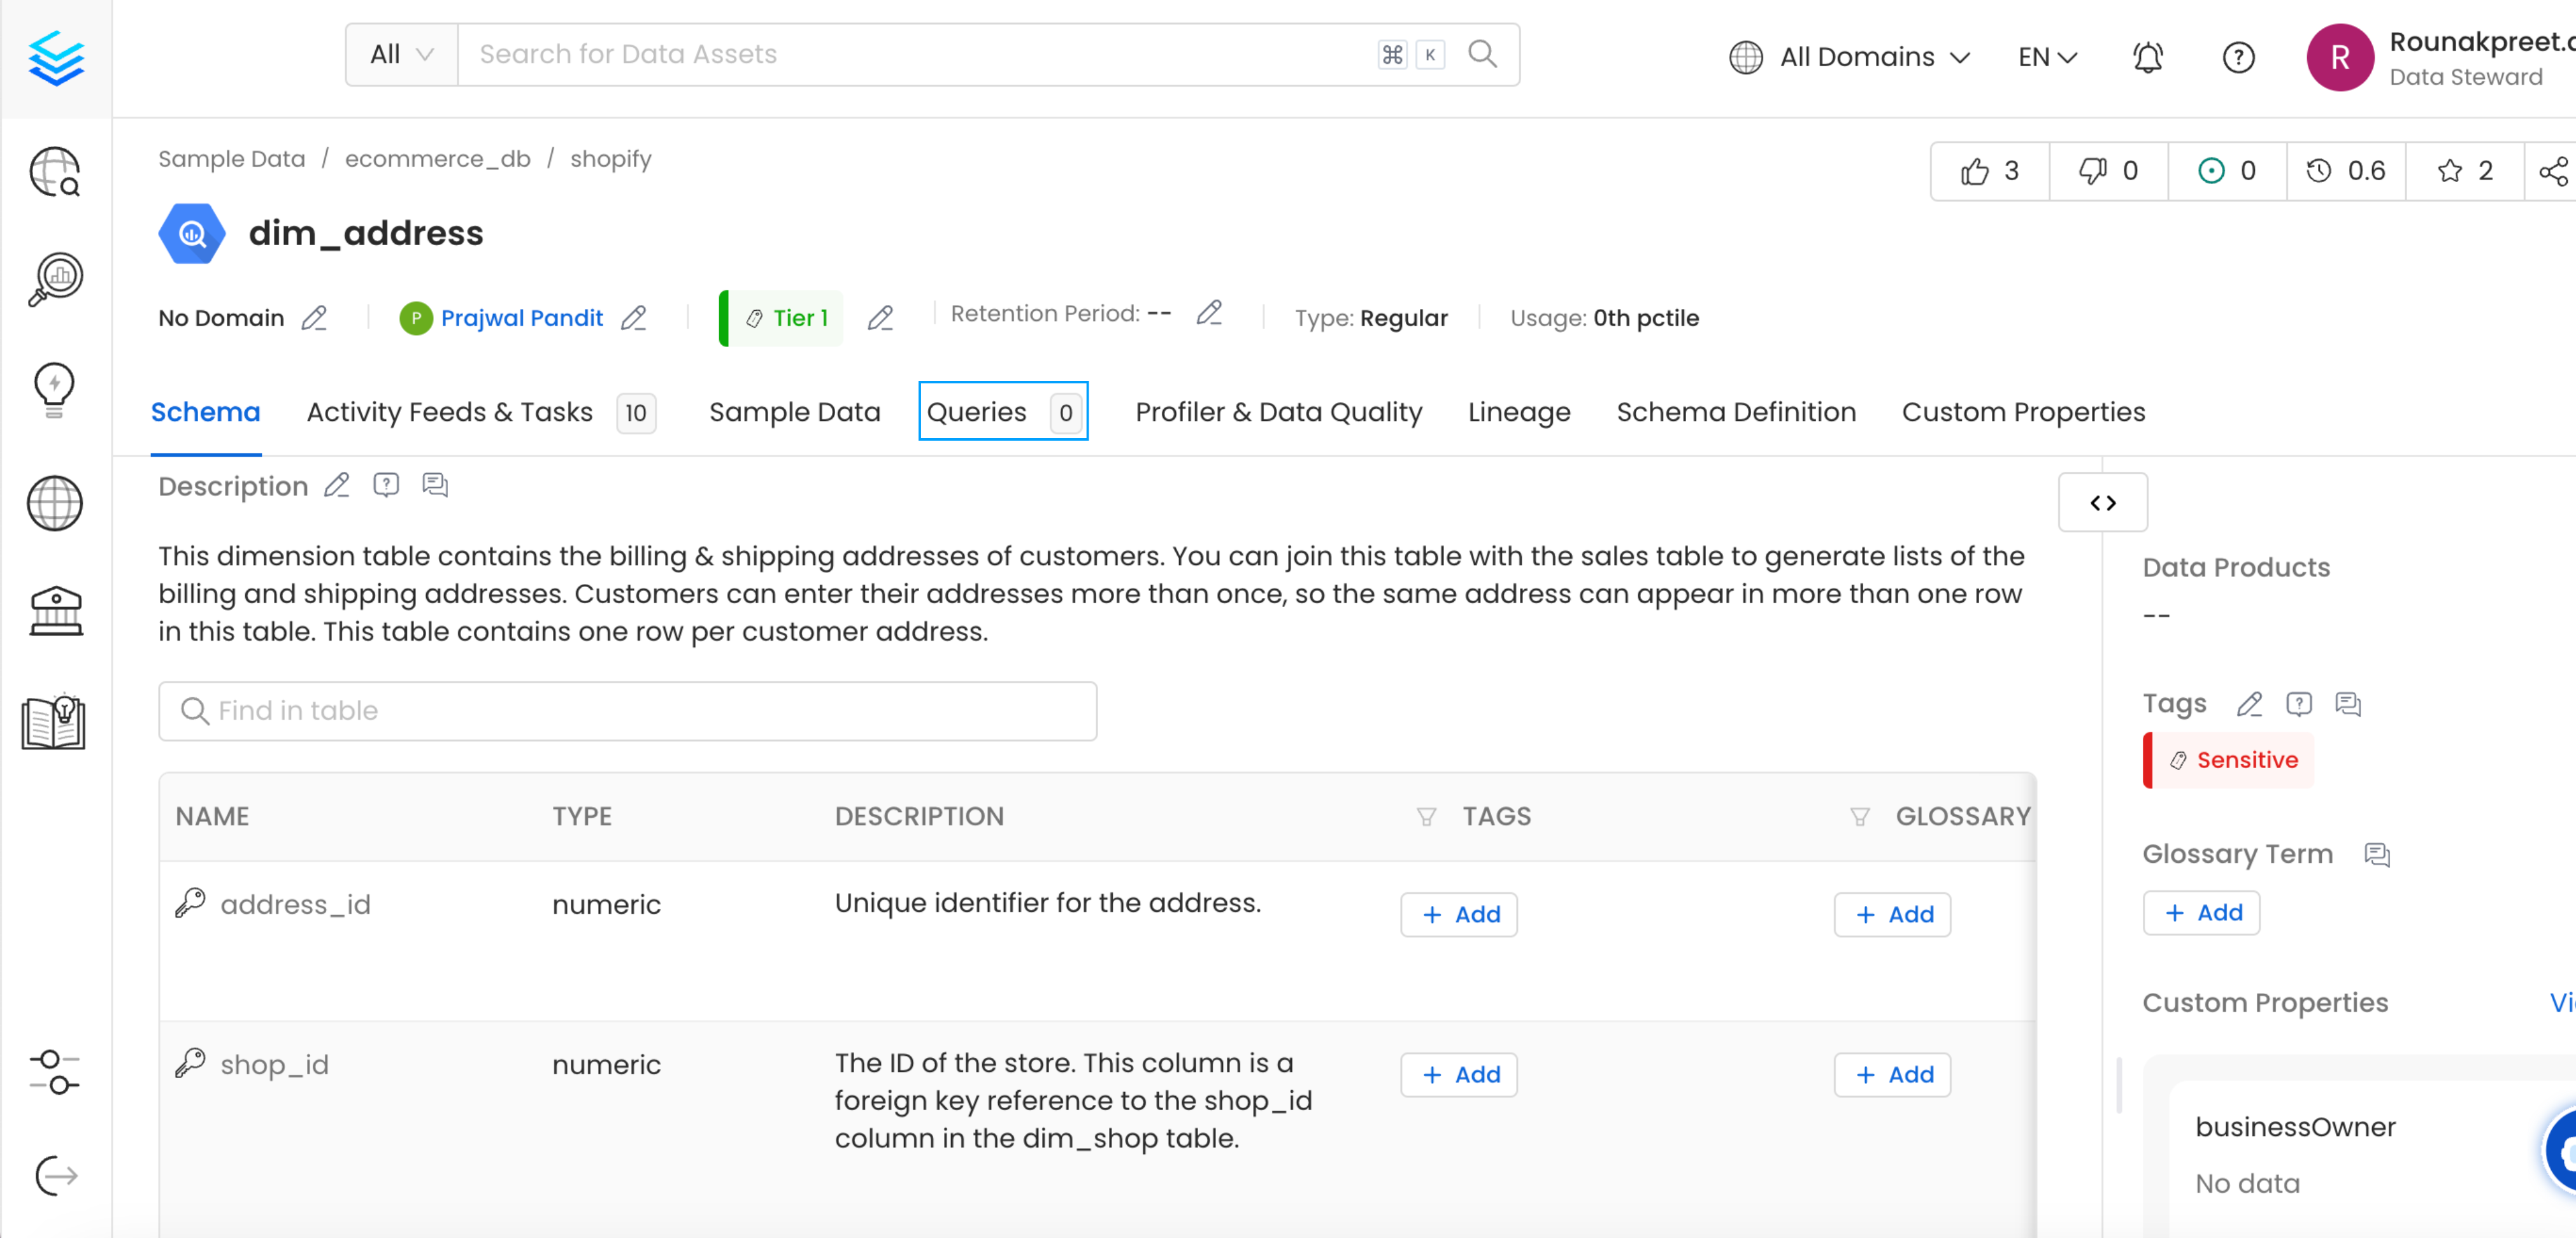 We can create a workflow that will obtain the query log and table creation information from the underlying database and feed it to OpenMetadata. The Usage Ingestion will be in charge of obtaining this data.
### 1. Add a Usage Ingestion
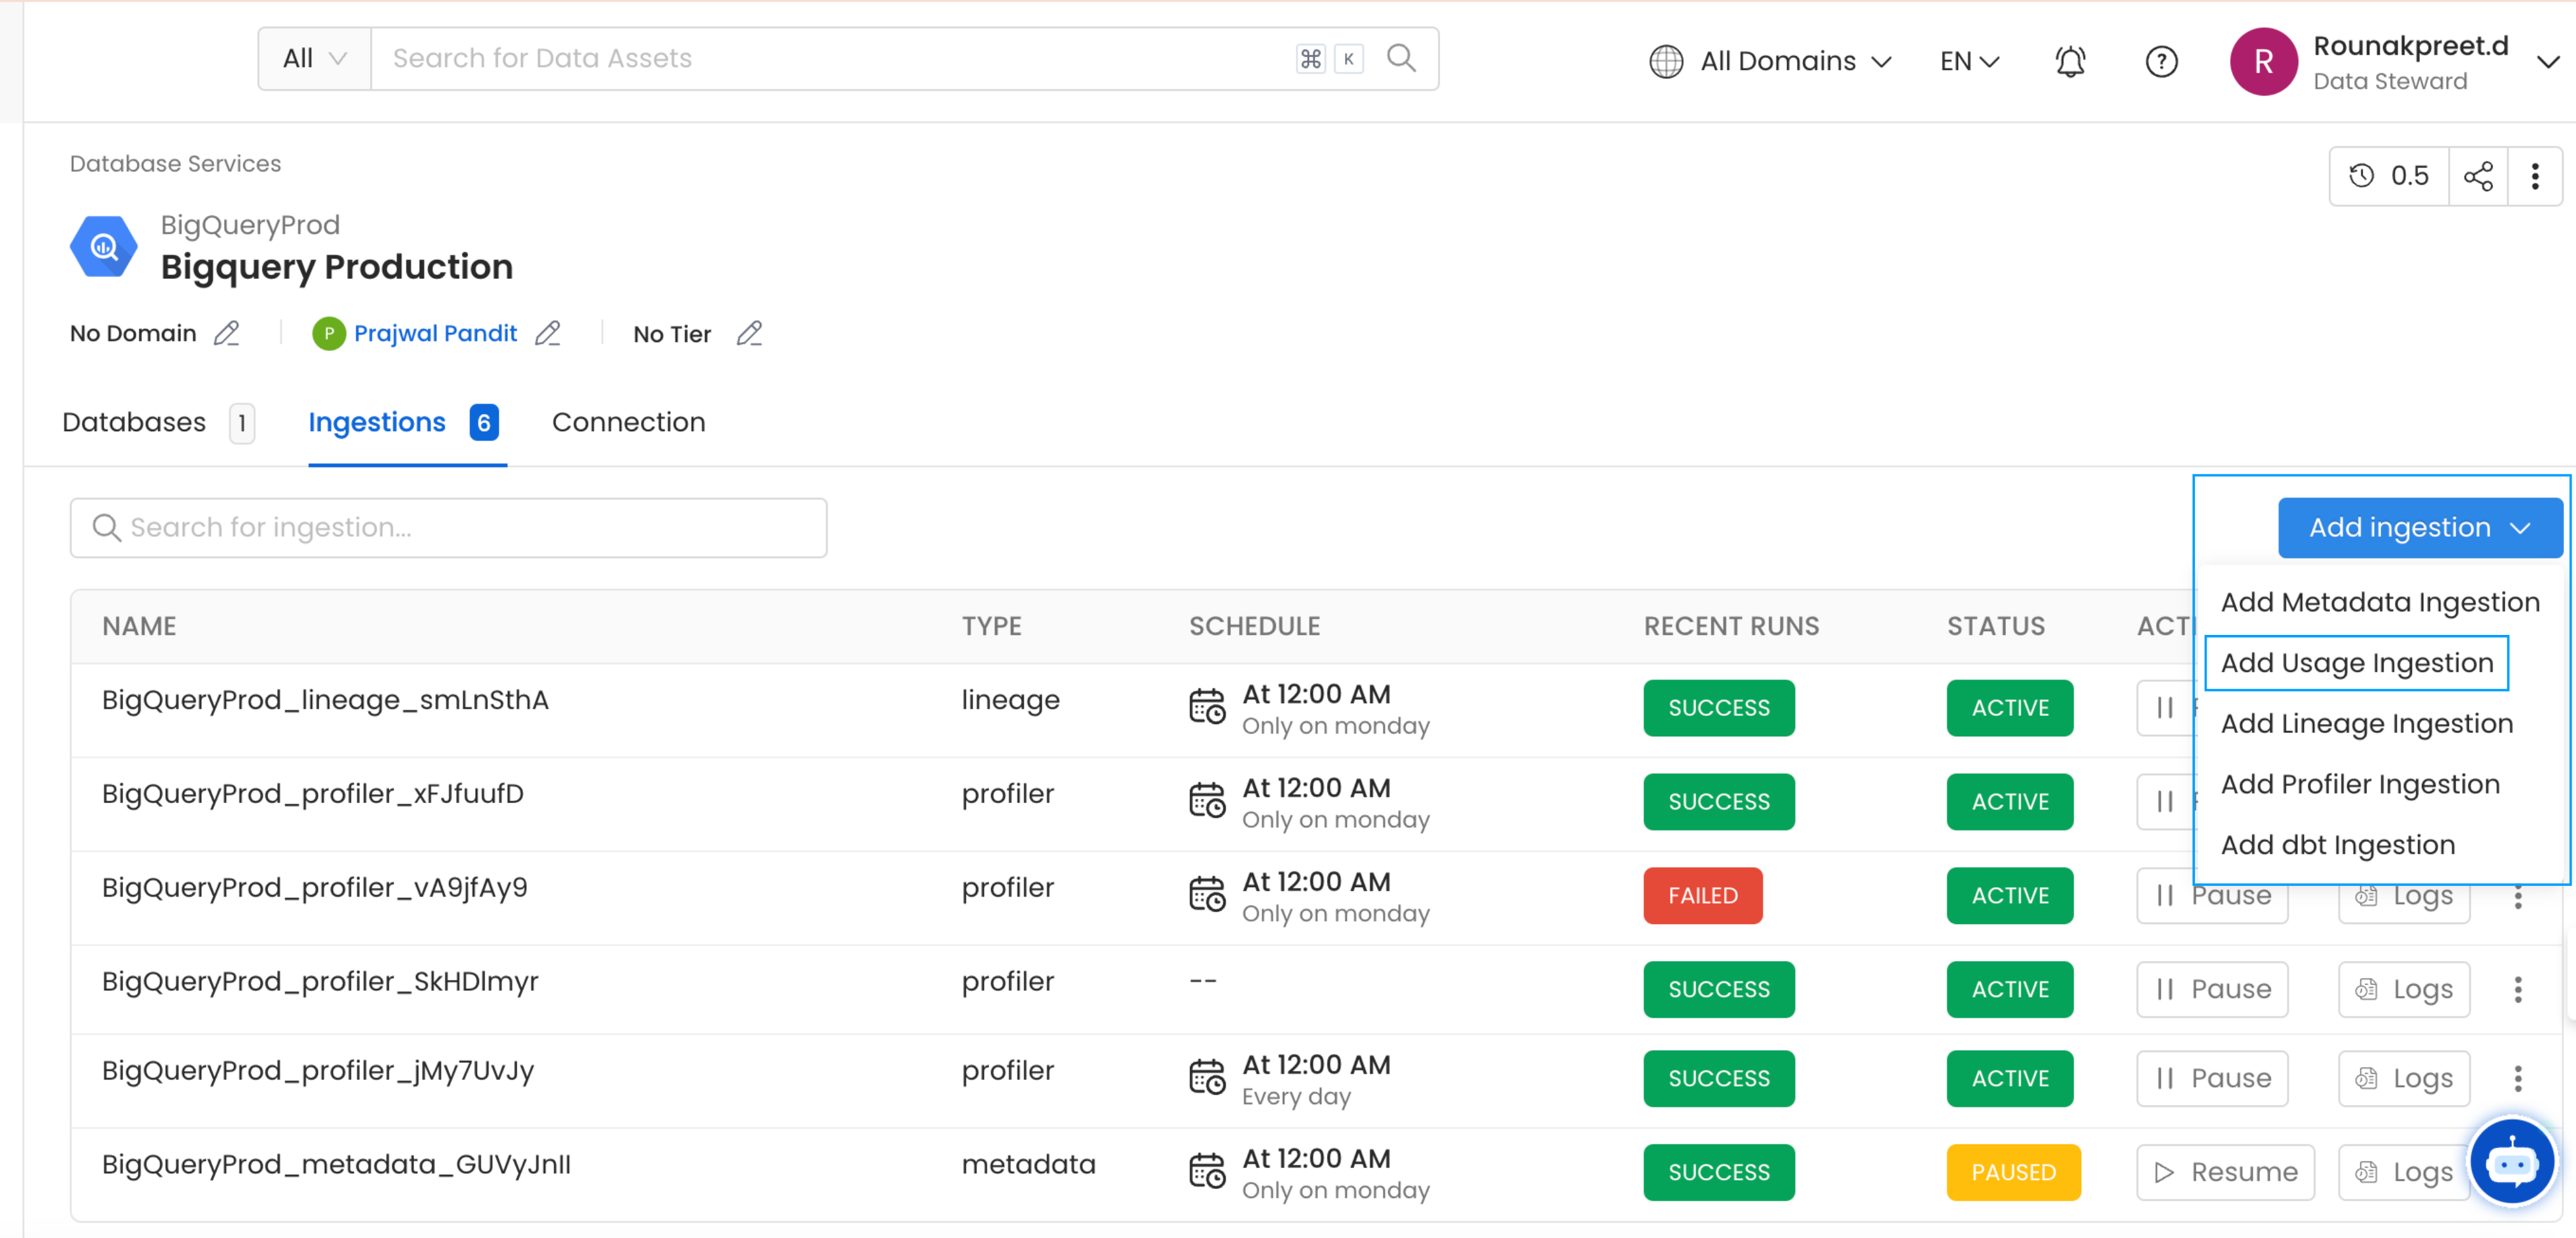
From the Service Page, go to the Ingestions tab to add a new ingestion and click on Add Usage Ingestion.
We can create a workflow that will obtain the query log and table creation information from the underlying database and feed it to OpenMetadata. The Usage Ingestion will be in charge of obtaining this data.
### 1. Add a Usage Ingestion
From the Service Page, go to the Ingestions tab to add a new ingestion and click on Add Usage Ingestion.
 ### 2. Configure the Usage Ingestion
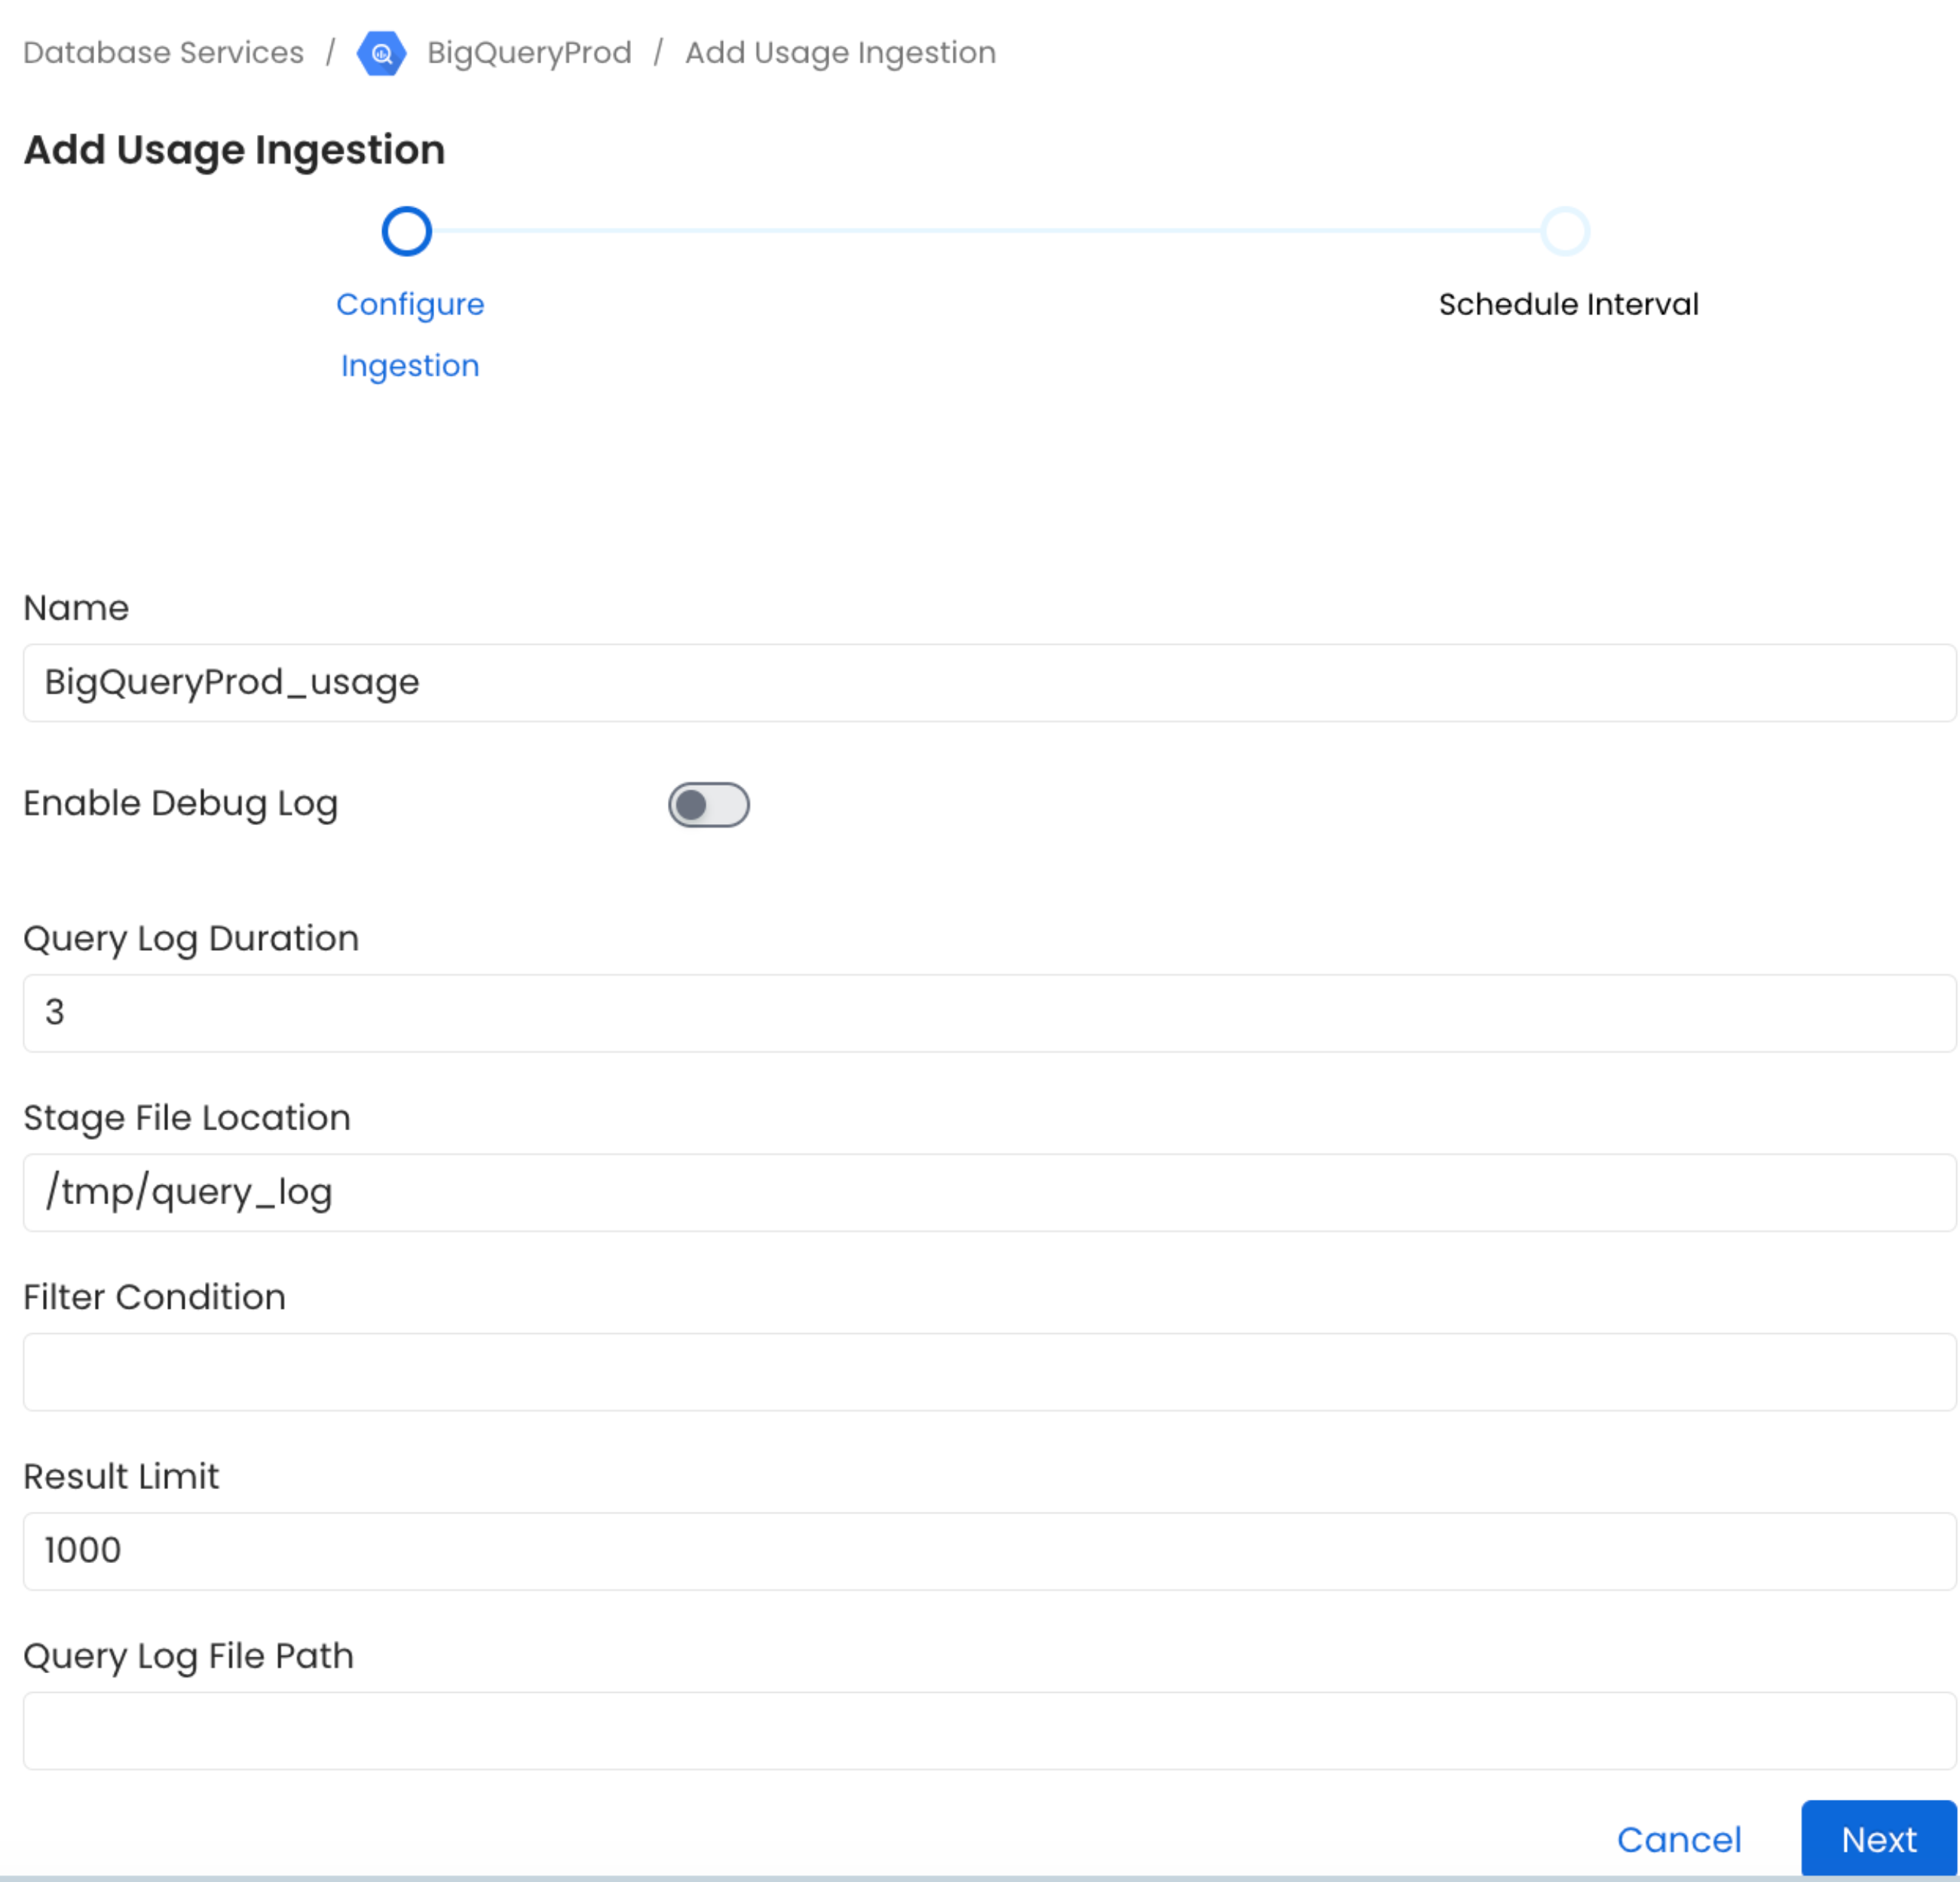
Here you can enter the Usage Ingestion details:
### 2. Configure the Usage Ingestion
Here you can enter the Usage Ingestion details:
 ### Usage Options
**Query Log Duration**
Specify the duration in days for which the usage should capture usage data from the query logs. For example, if you specify 2 as the value for the duration, the data usage will capture usage information for 48 hours prior to when the ingestion workflow is run.
**Stage File Location**
Mention the absolute file path of the temporary file name to store the query logs before processing.
**Result Limit**
Set the limit for the query log results to be run at a time.
### 3. Schedule and Deploy
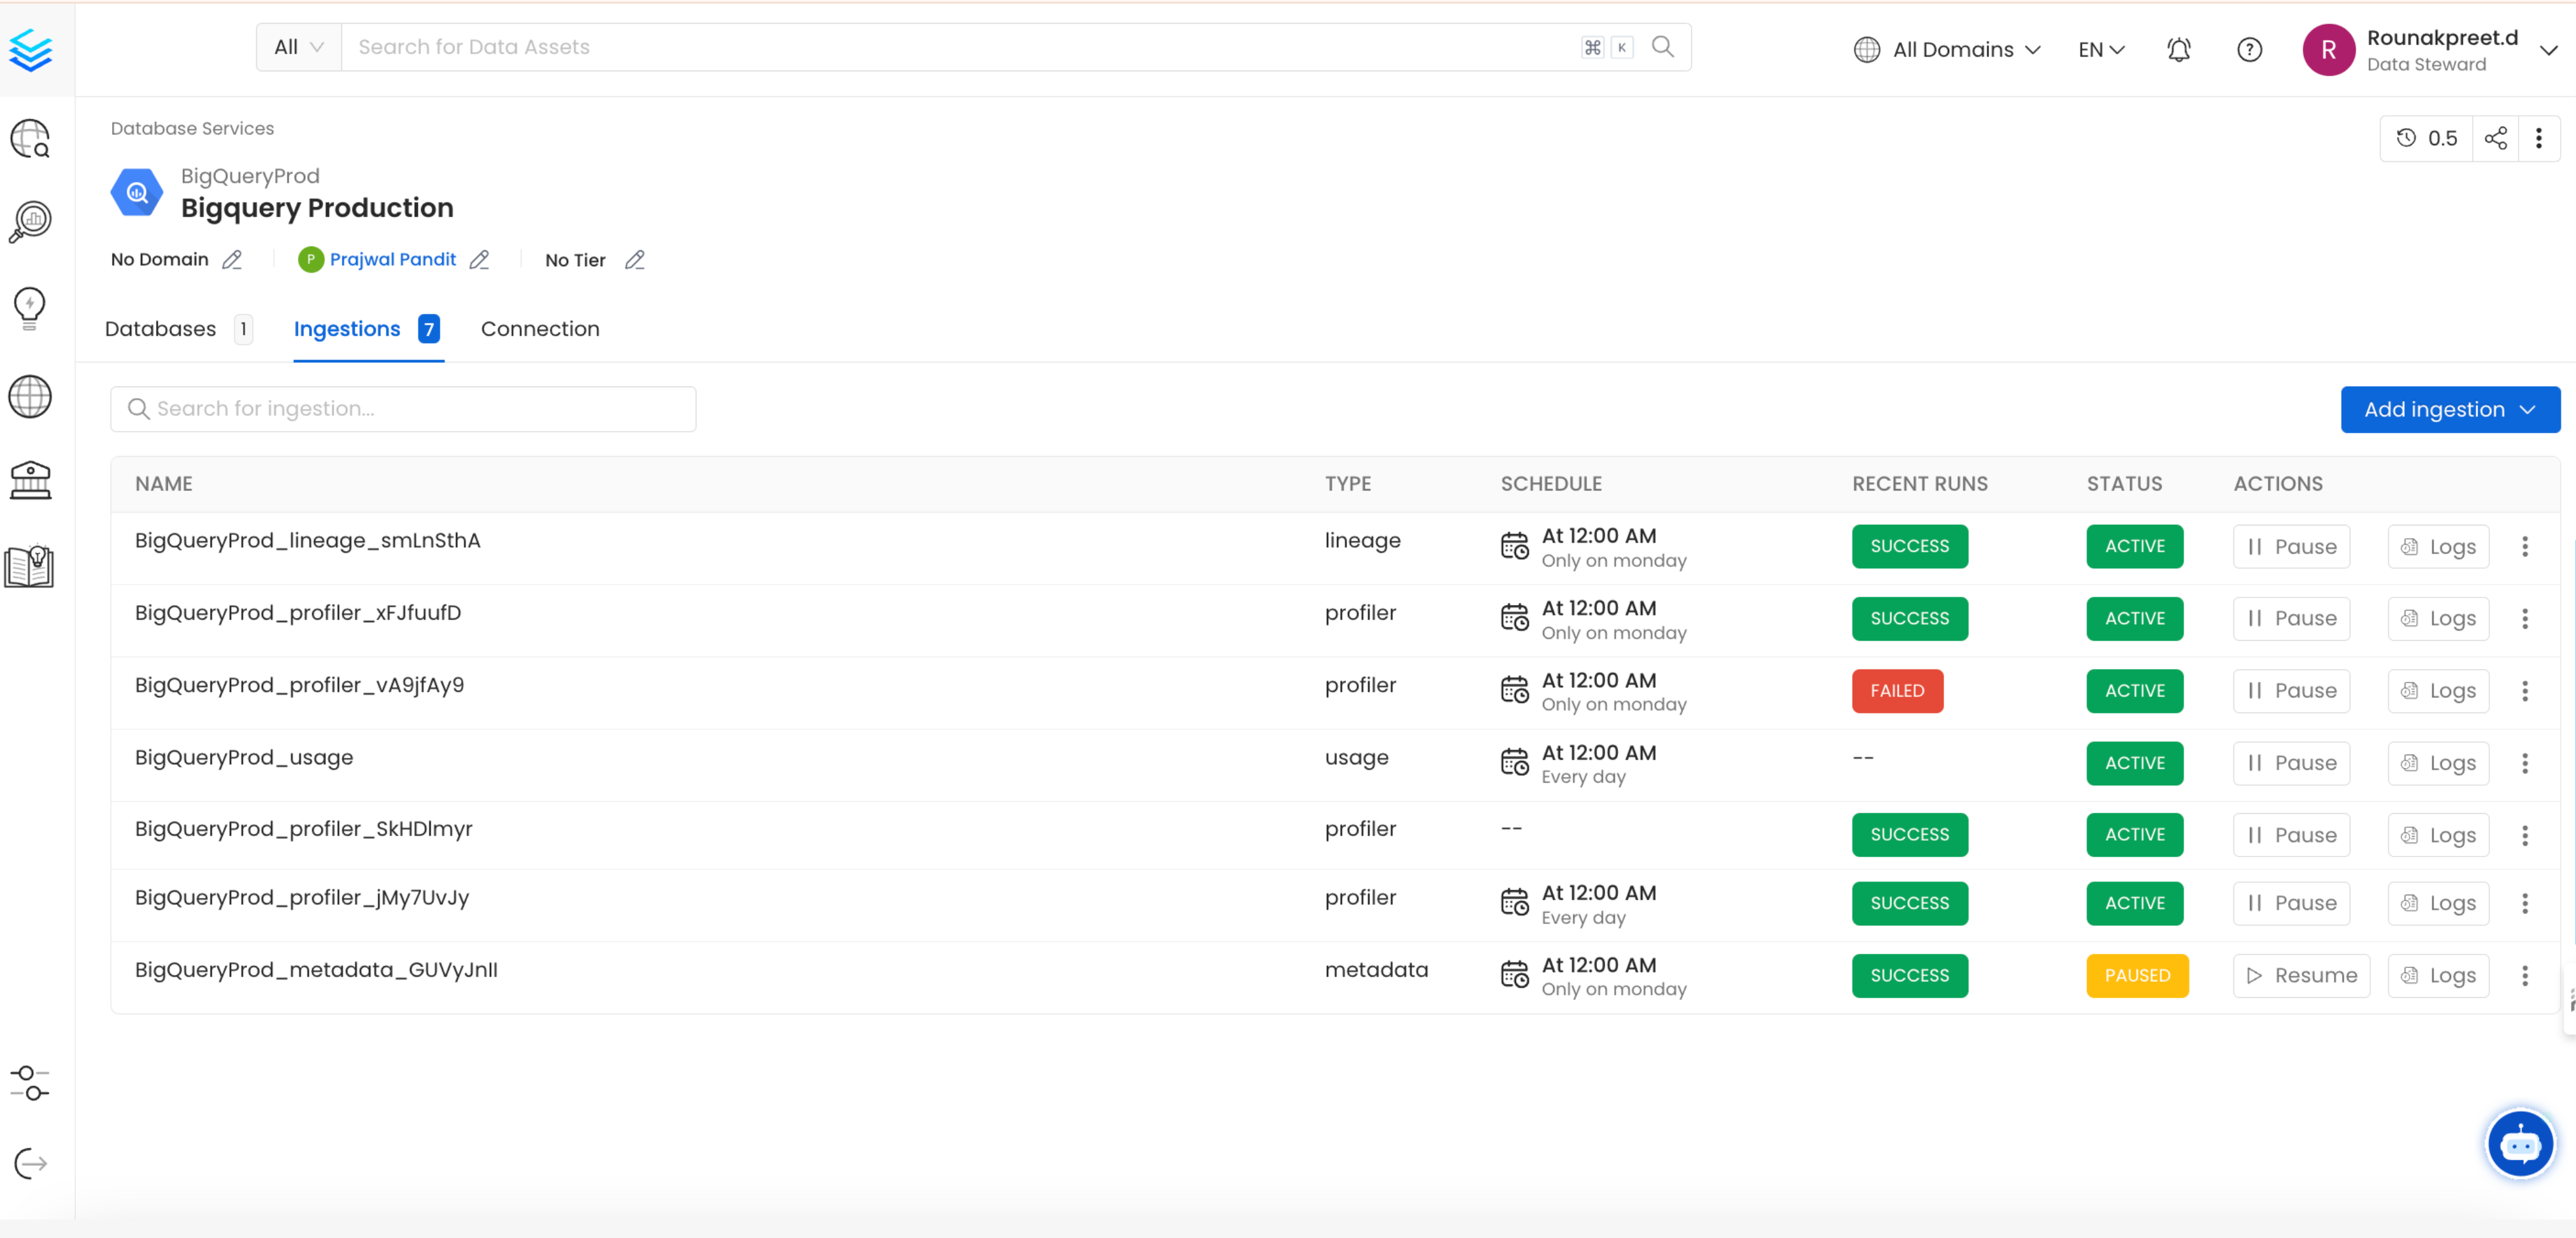
After clicking Next, you will be redirected to the Scheduling form. This will be the same as the Metadata Ingestion. Select your desired schedule and click on Deploy to find the usage pipeline being added to the Service Ingestions.
### Usage Options
**Query Log Duration**
Specify the duration in days for which the usage should capture usage data from the query logs. For example, if you specify 2 as the value for the duration, the data usage will capture usage information for 48 hours prior to when the ingestion workflow is run.
**Stage File Location**
Mention the absolute file path of the temporary file name to store the query logs before processing.
**Result Limit**
Set the limit for the query log results to be run at a time.
### 3. Schedule and Deploy
After clicking Next, you will be redirected to the Scheduling form. This will be the same as the Metadata Ingestion. Select your desired schedule and click on Deploy to find the usage pipeline being added to the Service Ingestions.
 ## YAML Configuration
In the [connectors](/v1.12.x/connectors) section we showcase how to run the metadata ingestion from a JSON/YAML file using the Airflow SDK or the CLI via metadata ingest. Running a usage workflow is also possible using a JSON/YAML configuration file.
This is a good option if you wish to execute your workflow via the Airflow SDK or using the CLI; if you use the CLI a usage workflow can be triggered with the command `metadata usage -c FILENAME.yaml`. The `serviceConnection` config will be specific to your connector (you can find more information in the [connectors](/v1.12.x/connectors) section), though the sourceConfig for the usage will be similar across all connectors.
## Query Usage
The Query Usage workflow will be using the `query-parser` processor.
After running a Metadata Ingestion workflow, we can run Query Usage workflow.
While the `serviceName` will be the same to that was used in Metadata Ingestion, so the ingestion bot can get the `serviceConnection` details from the server.
### 1. Define the YAML Config
This is a sample config for {connector_0} Usage:
Configure the source type and service name for your usage workflow.
**type**: Set to `DatabaseUsage` for database usage ingestion.
**queryLogDuration**: Configuration to tune how far we want to look back in query logs to process usage data (in days).
**stageFileLocation**: Temporary file name to store the query logs before processing. Absolute file path required.
Note that the location is a directory that will be cleaned at the end of the ingestion.
**resultLimit**: Configuration to set the limit for query logs.
**queryLogFilePath**: Configuration to set the file path for query logs. If instead of getting the query logs from the database we want to pass a file with the queries.
Choose the `query-parser` processor to parse and process the query logs.
Configure the staging location for table usage data before it's sent to OpenMetadata.
Configure the bulk sink for metadata usage ingestion.
```yaml theme={null}
source:
type: bigquery-usage
serviceName: bigquery
sourceConfig:
config:
type: DatabaseUsage
# Number of days to look back
queryLogDuration: 7
# This is a directory that will be DELETED after the usage runs
stageFileLocation:
# resultLimit: 1000
# If instead of getting the query logs from the database we want to pass a file with the queries
# queryLogFilePath: path-to-file
processor:
type: query-parser
config: {}
stage:
type: table-usage
config:
filename: /tmp/bigquery_usage
bulkSink:
type: metadata-usage
config:
filename: /tmp/bigquery_usage
```
### 2. Run with the CLI
After saving the YAML config, we will run the command the same way we did for the metadata ingestion:
```bash theme={null}
metadata usage -c
```
## YAML Configuration
In the [connectors](/v1.12.x/connectors) section we showcase how to run the metadata ingestion from a JSON/YAML file using the Airflow SDK or the CLI via metadata ingest. Running a usage workflow is also possible using a JSON/YAML configuration file.
This is a good option if you wish to execute your workflow via the Airflow SDK or using the CLI; if you use the CLI a usage workflow can be triggered with the command `metadata usage -c FILENAME.yaml`. The `serviceConnection` config will be specific to your connector (you can find more information in the [connectors](/v1.12.x/connectors) section), though the sourceConfig for the usage will be similar across all connectors.
## Query Usage
The Query Usage workflow will be using the `query-parser` processor.
After running a Metadata Ingestion workflow, we can run Query Usage workflow.
While the `serviceName` will be the same to that was used in Metadata Ingestion, so the ingestion bot can get the `serviceConnection` details from the server.
### 1. Define the YAML Config
This is a sample config for {connector_0} Usage:
Configure the source type and service name for your usage workflow.
**type**: Set to `DatabaseUsage` for database usage ingestion.
**queryLogDuration**: Configuration to tune how far we want to look back in query logs to process usage data (in days).
**stageFileLocation**: Temporary file name to store the query logs before processing. Absolute file path required.
Note that the location is a directory that will be cleaned at the end of the ingestion.
**resultLimit**: Configuration to set the limit for query logs.
**queryLogFilePath**: Configuration to set the file path for query logs. If instead of getting the query logs from the database we want to pass a file with the queries.
Choose the `query-parser` processor to parse and process the query logs.
Configure the staging location for table usage data before it's sent to OpenMetadata.
Configure the bulk sink for metadata usage ingestion.
```yaml theme={null}
source:
type: bigquery-usage
serviceName: bigquery
sourceConfig:
config:
type: DatabaseUsage
# Number of days to look back
queryLogDuration: 7
# This is a directory that will be DELETED after the usage runs
stageFileLocation:
# resultLimit: 1000
# If instead of getting the query logs from the database we want to pass a file with the queries
# queryLogFilePath: path-to-file
processor:
type: query-parser
config: {}
stage:
type: table-usage
config:
filename: /tmp/bigquery_usage
bulkSink:
type: metadata-usage
config:
filename: /tmp/bigquery_usage
```
### 2. Run with the CLI
After saving the YAML config, we will run the command the same way we did for the metadata ingestion:
```bash theme={null}
metadata usage -c
```