> ## Documentation Index
> Fetch the complete documentation index at: https://docs.open-metadata.org/llms.txt
> Use this file to discover all available pages before exploring further.
# Custom Metrics
# Custom Metrics
Custom metrics in OpenMetadata enhance profiling capabilities by enabling users to define and compute unique business metrics using custom SQL queries. These metrics can be added at both the table and column levels, allowing tailored analysis specific to organizational needs. Once defined, custom metrics are incorporated into the profiler workflow, and their computed values are displayed alongside system metrics in the table and column profiles. This feature provides a flexible way to track specific data insights, empowering users to gain deeper visibility into their datasets.
## Table-Level Metrics
* Navigate to the **Database** and switch to the **Data Observability** tab. Click on **Table Profile**, and on the right-hand side, select the **Add** option to access the custom metric feature.
 * Enter a meaningful name for the custom metric and input the required SQL query based on your data requirements.
 * Once the custom metric is defined, run the **Profiler Agent** in the **Database Services**.
 * After running the profiler agent, return to the same dataset to view the computed custom metric within the table profile.
 ## Column-Level Metrics
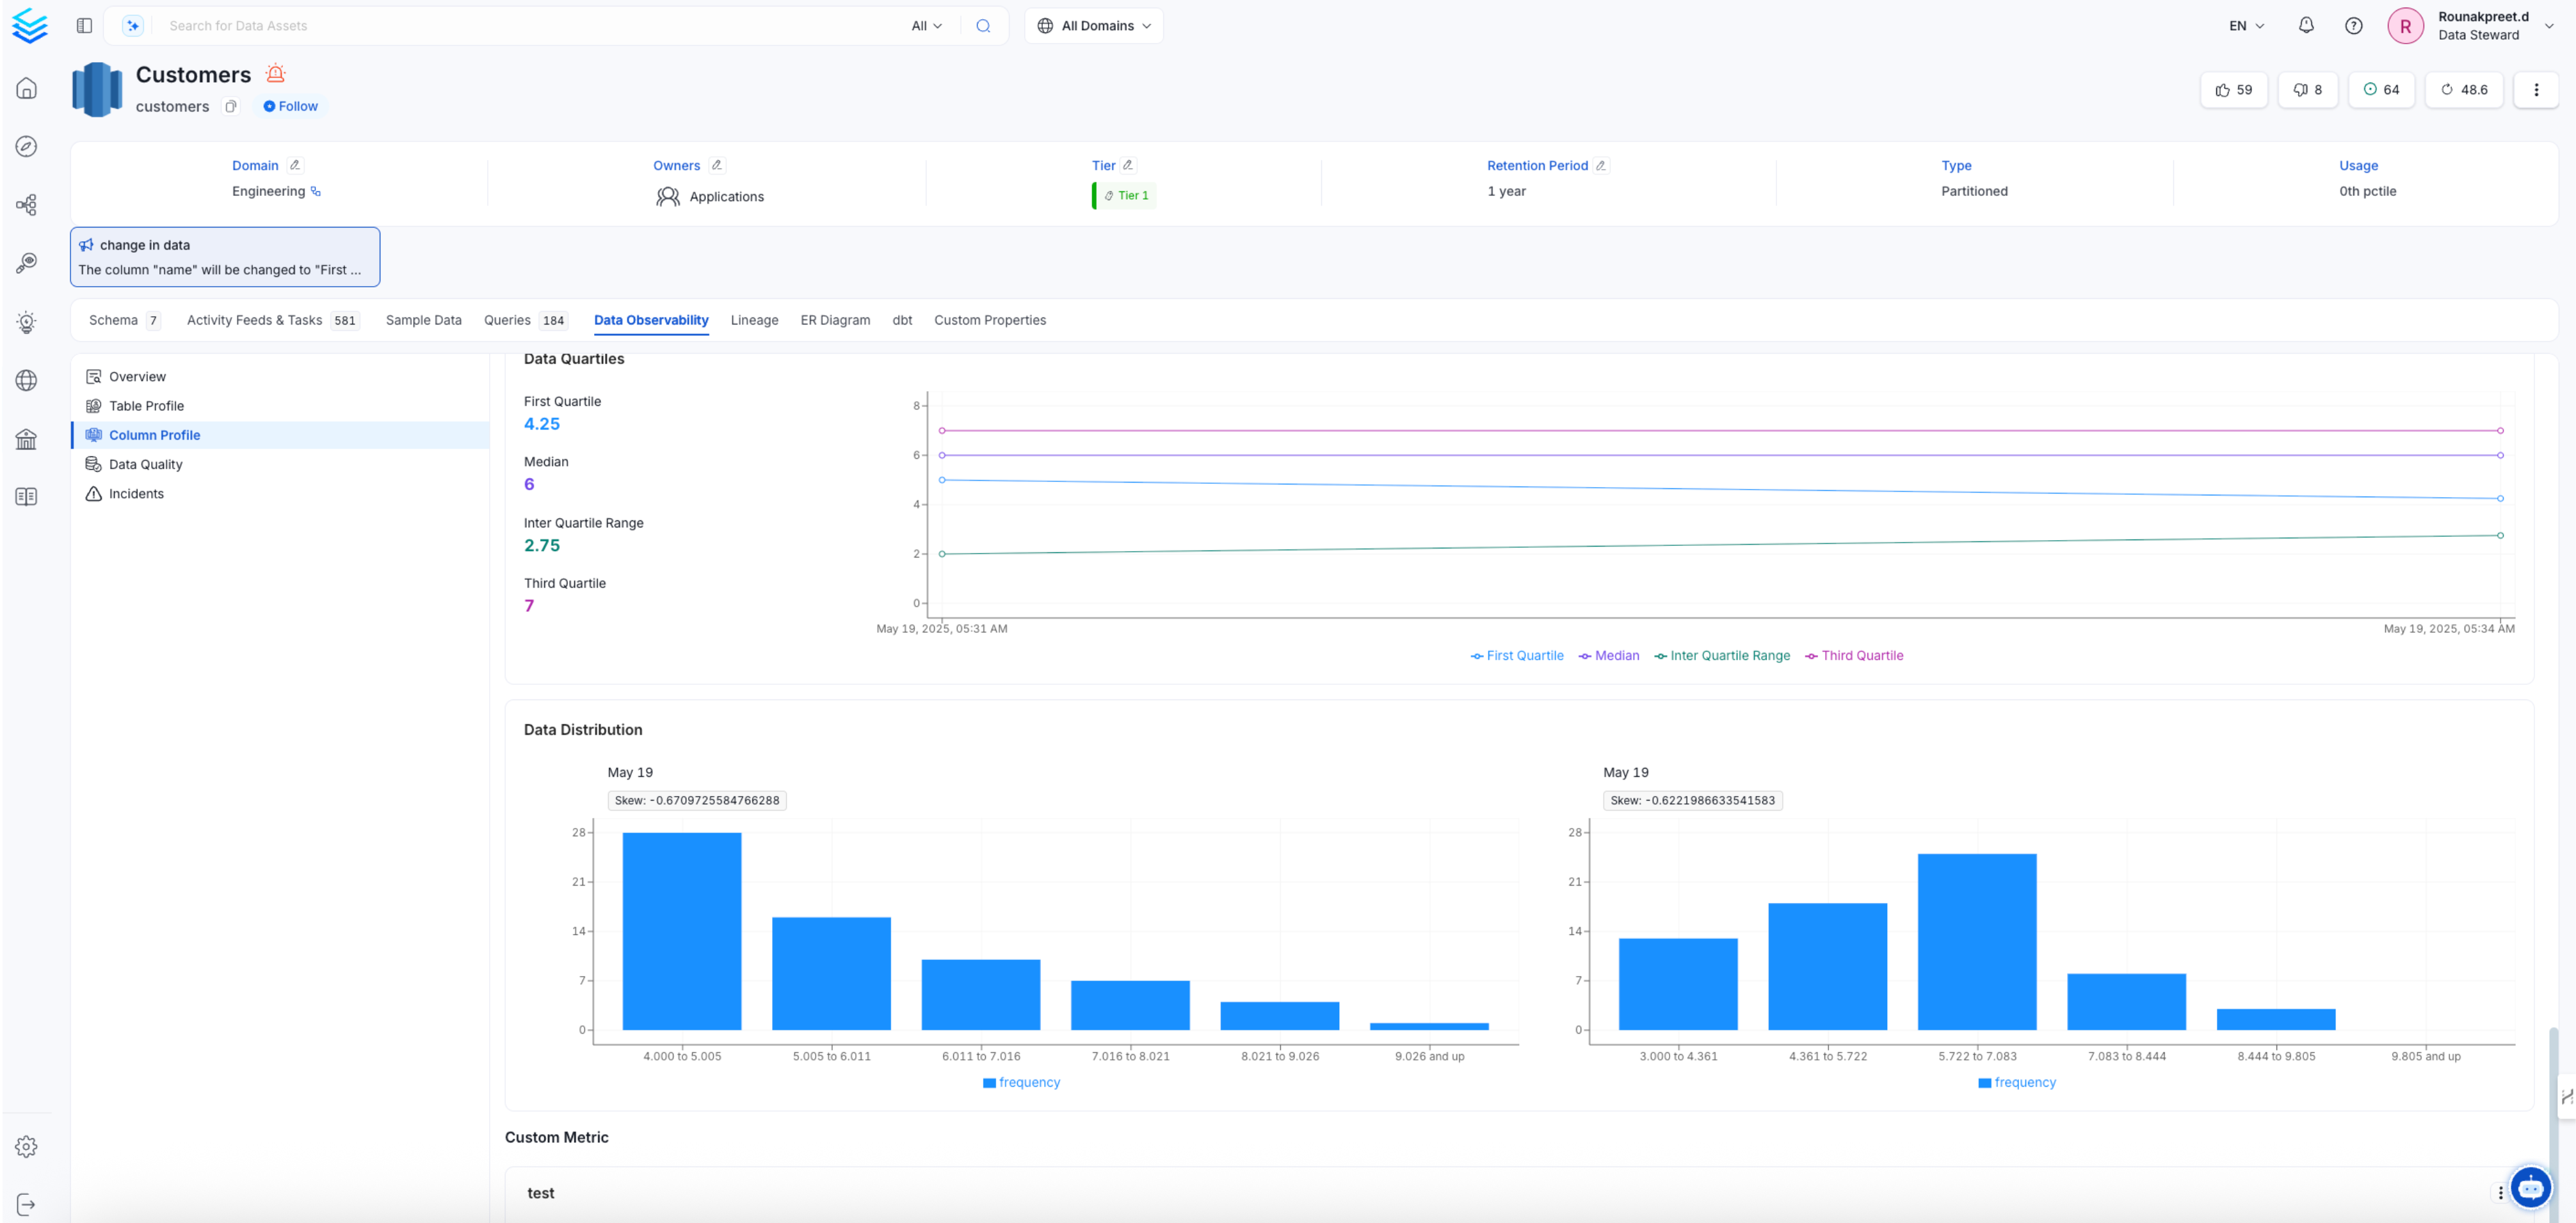
* Navigate to the **Database** and switch to the **Data Observability** tab. Click on **Column Profile**, and on the right-hand side, select the **Add** option to access the custom metric feature.
* After clicking on Custom Metric, provide a name, select column name, and define the SQL query.
## Column-Level Metrics
* Navigate to the **Database** and switch to the **Data Observability** tab. Click on **Column Profile**, and on the right-hand side, select the **Add** option to access the custom metric feature.
* After clicking on Custom Metric, provide a name, select column name, and define the SQL query.
 * Save and run the profiler workflow to generate the metric.
 * After running the profiler agent, return to the same dataset to view the computed custom metric within the column profile.