Data Insights Report
The data insights report provides a quick glance at aspects like data ownership, description coverage, data tiering, and so on. Admins can view the aggregated user activity and get insights into user engagement and user growth. Admins can check for Daily active users and know how the tool is being used. The search option associated with each report helps to view filtered results.
OpenMetadata offers a suite of reports providing platform analytics around specific areas. The reports are available in the following sections:
- Data Assets
- App Analytics
- KPIs
- Cost Analysis (Collate only)
Data Insights Report
All the reports can be filtered by Teams, Data Tiers, and a Time Filter.
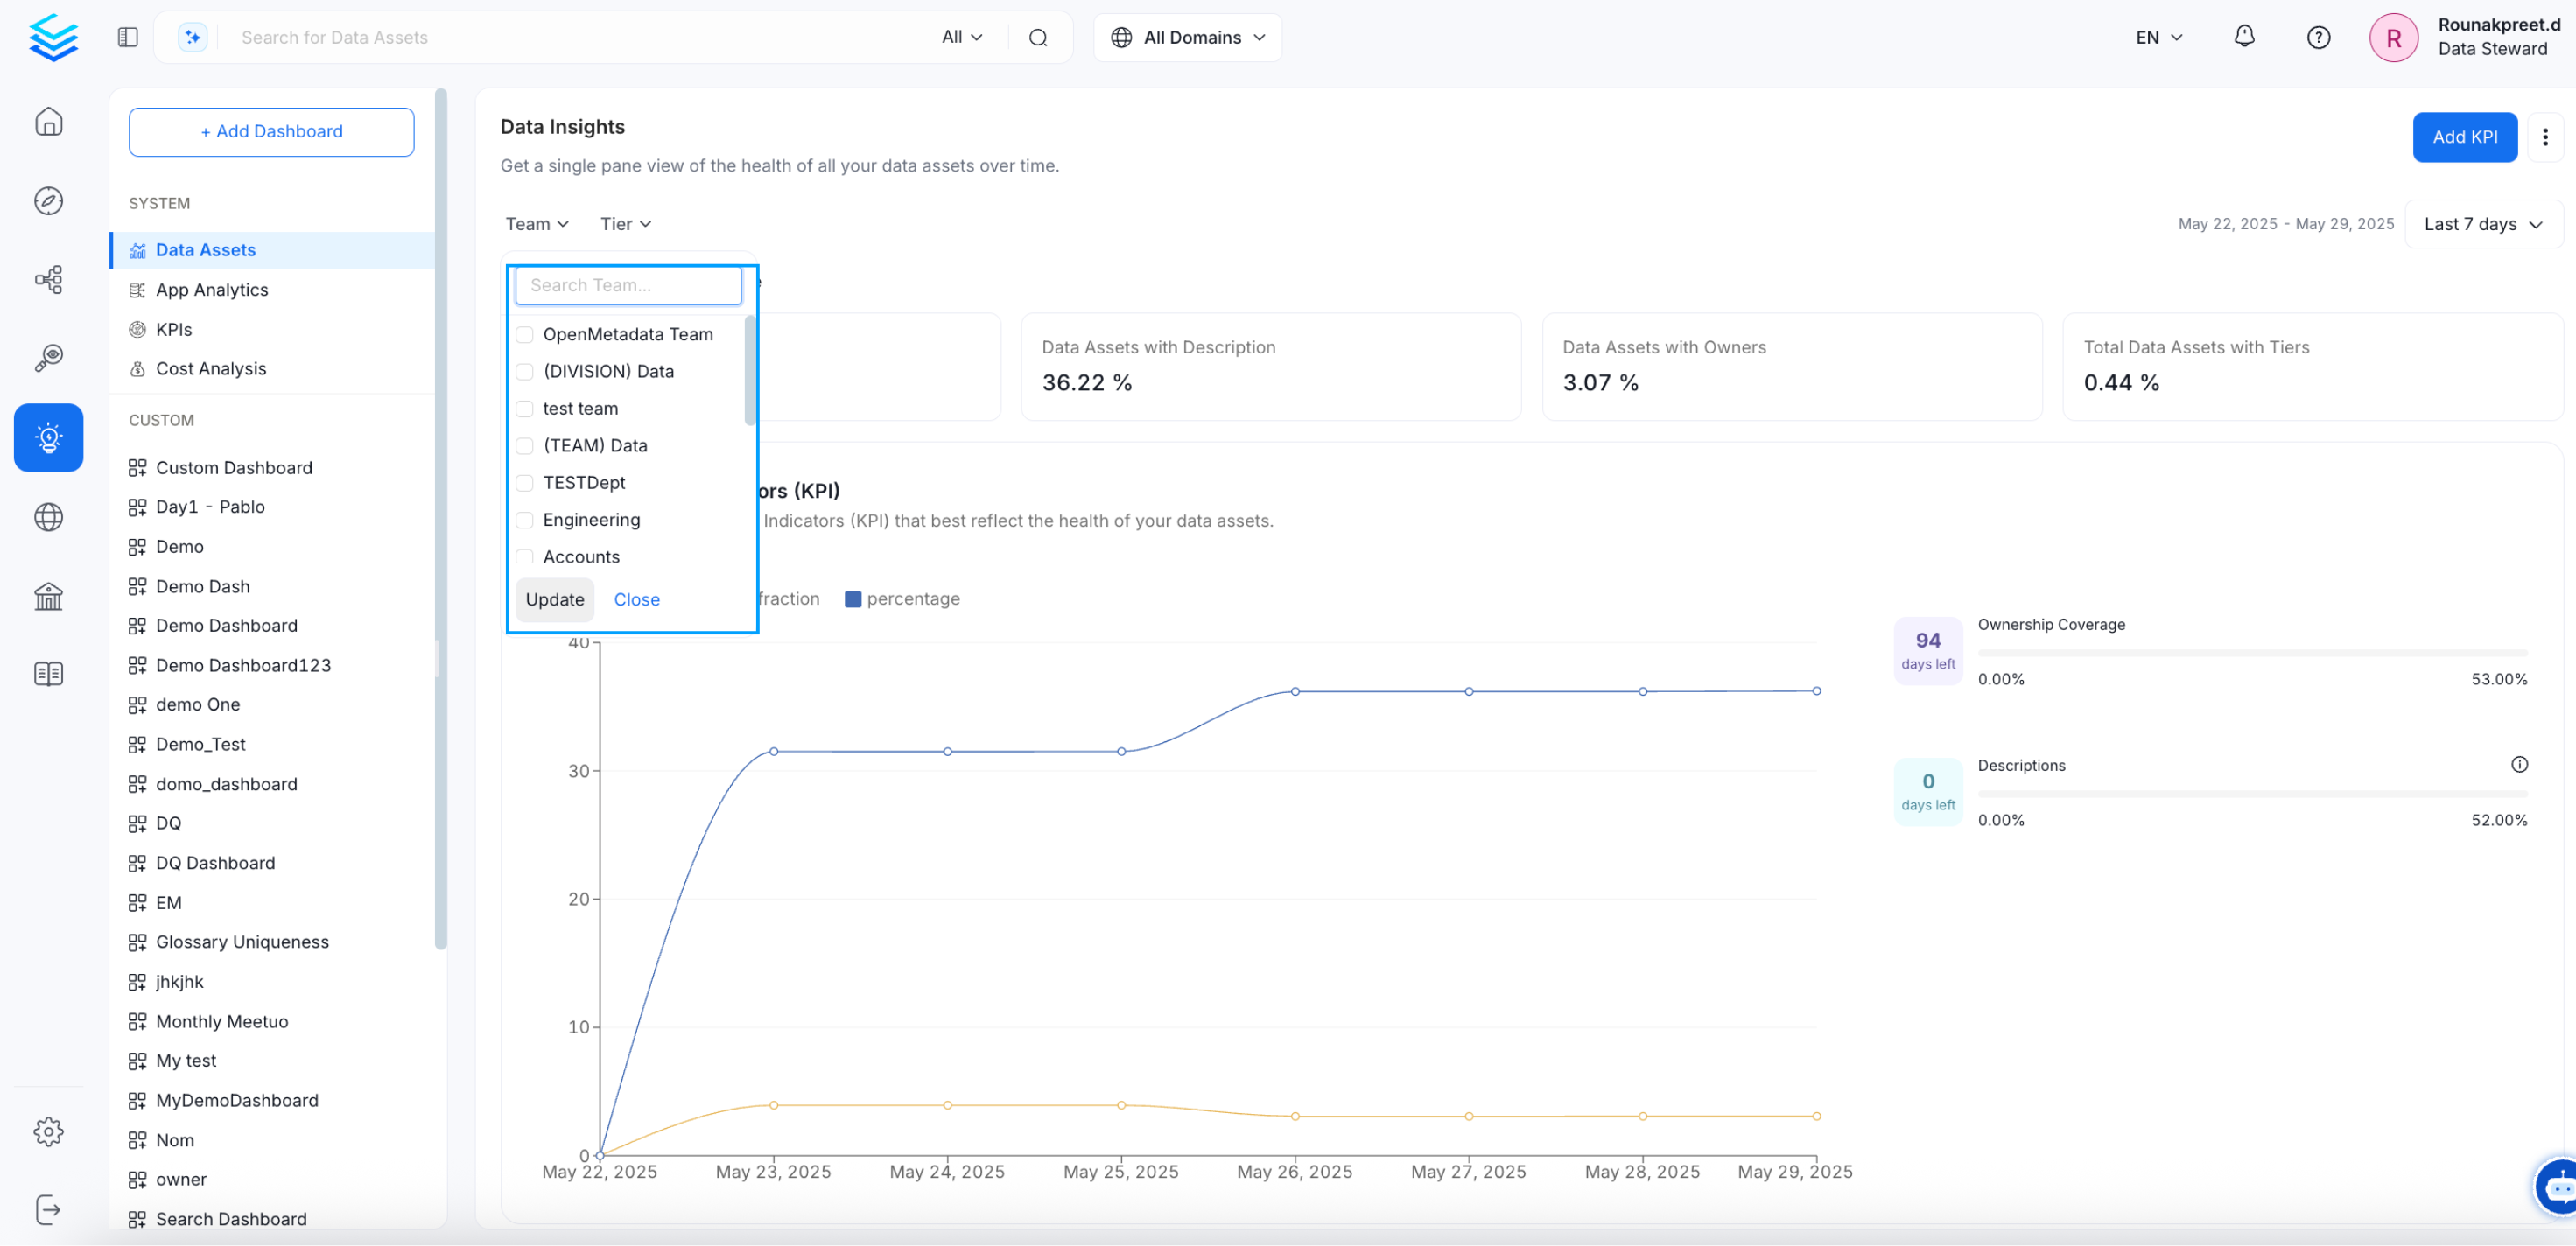
Data Insights Report Filter: Team
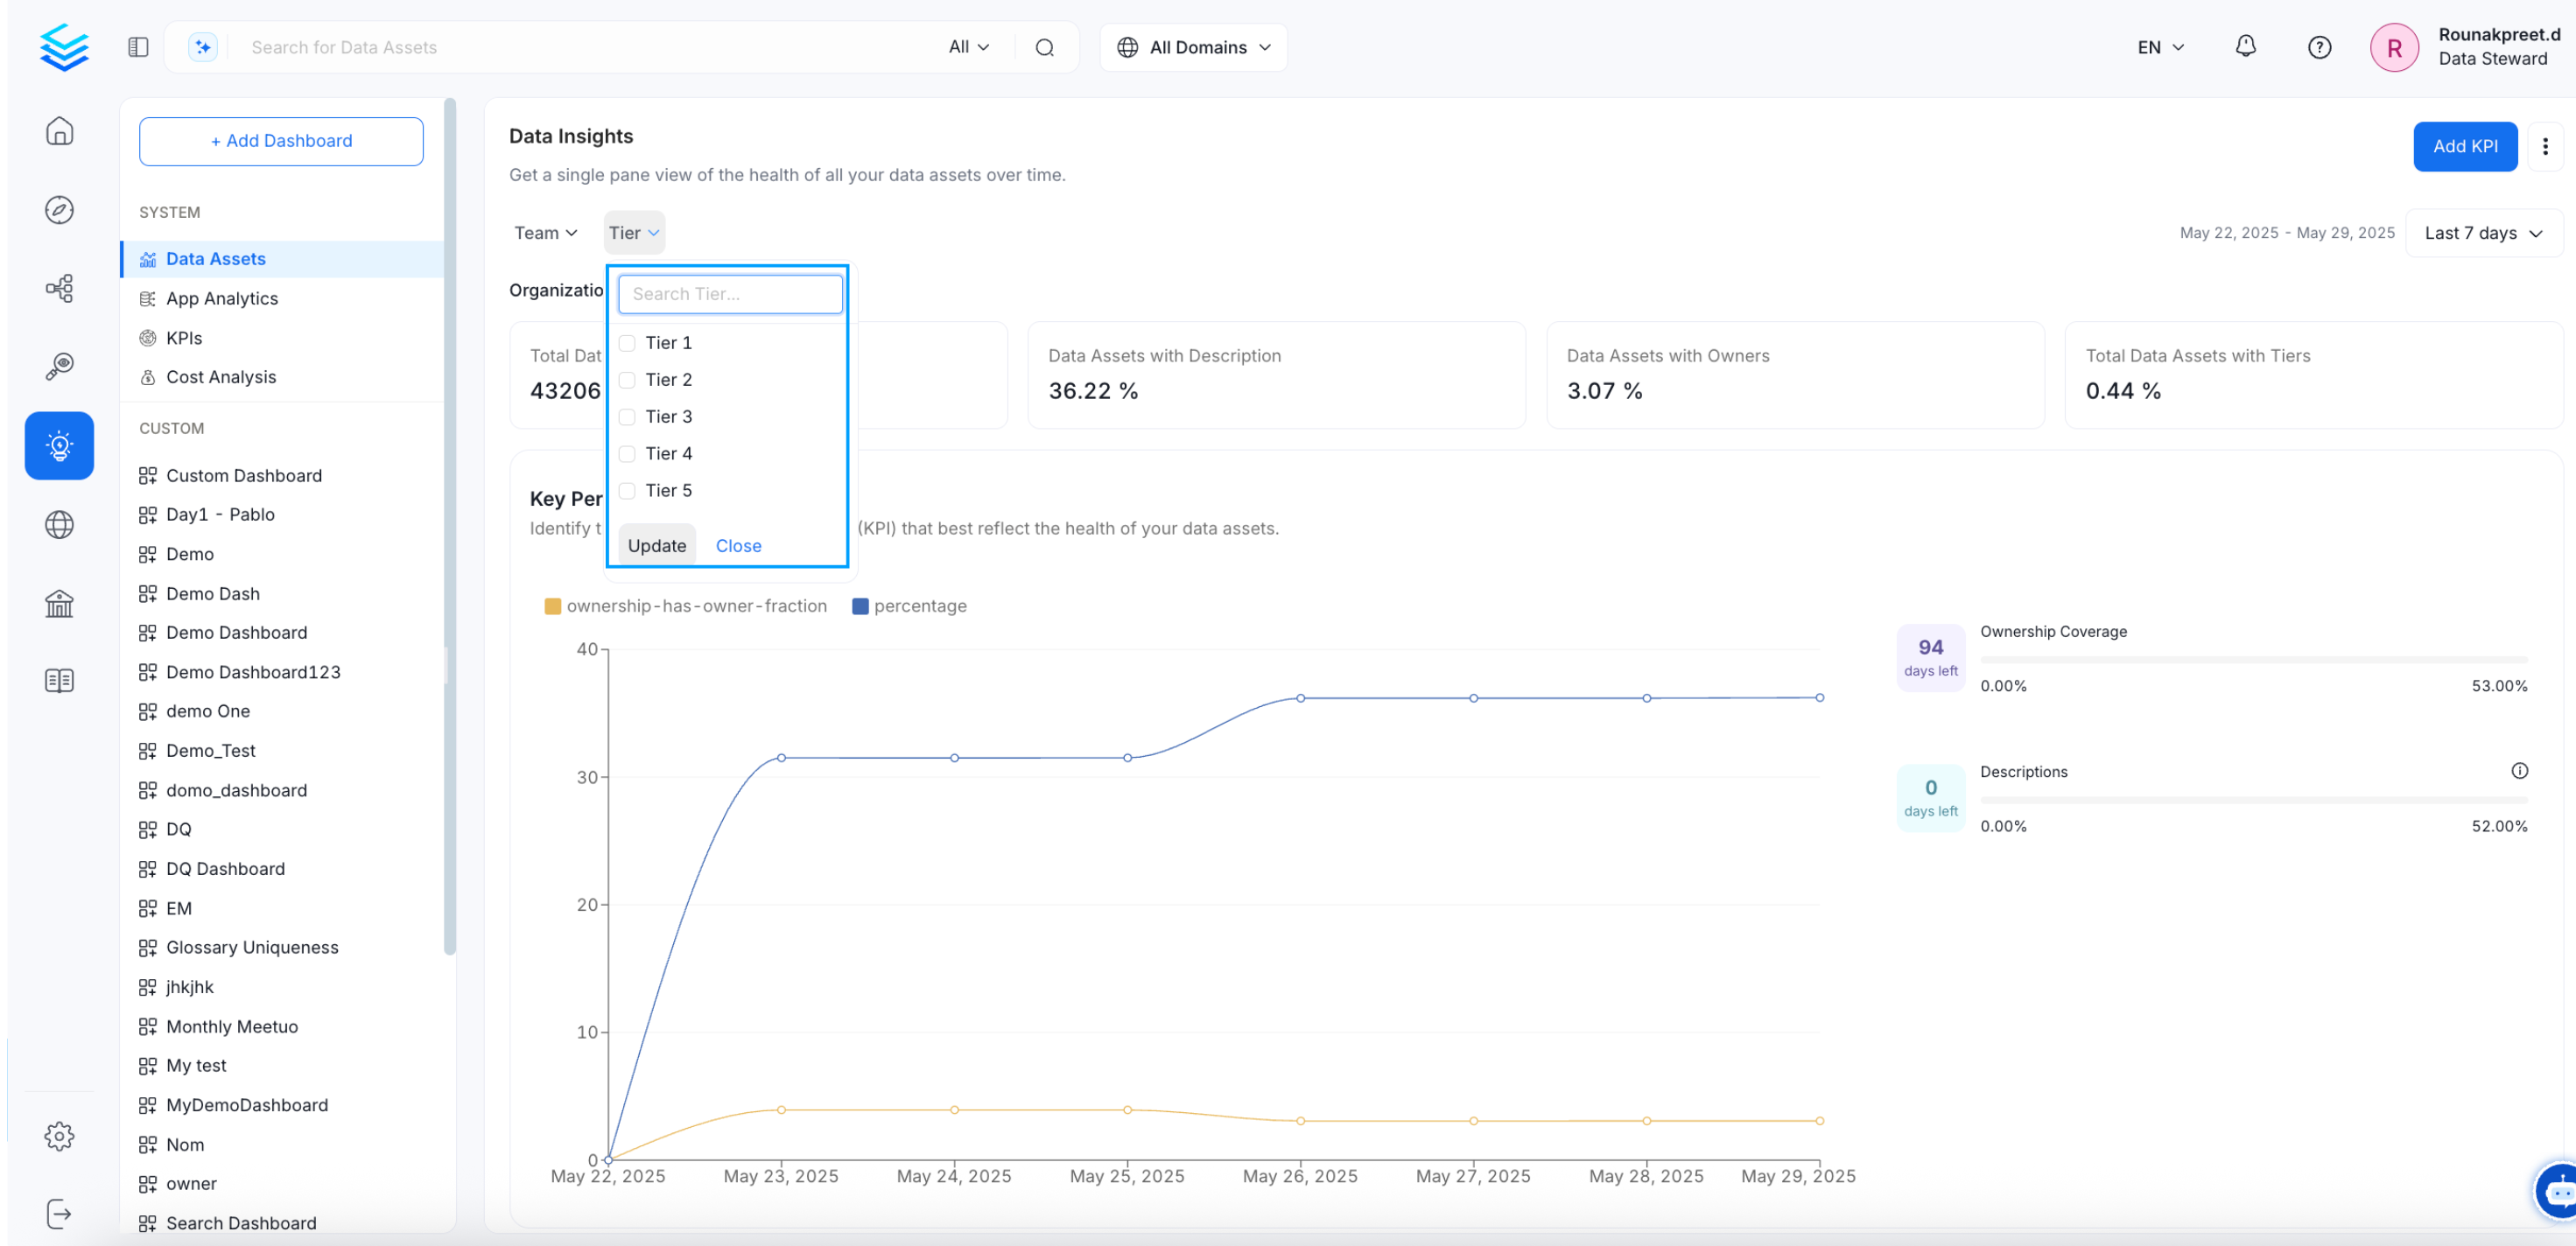
Data Insights Report Filter: Tier
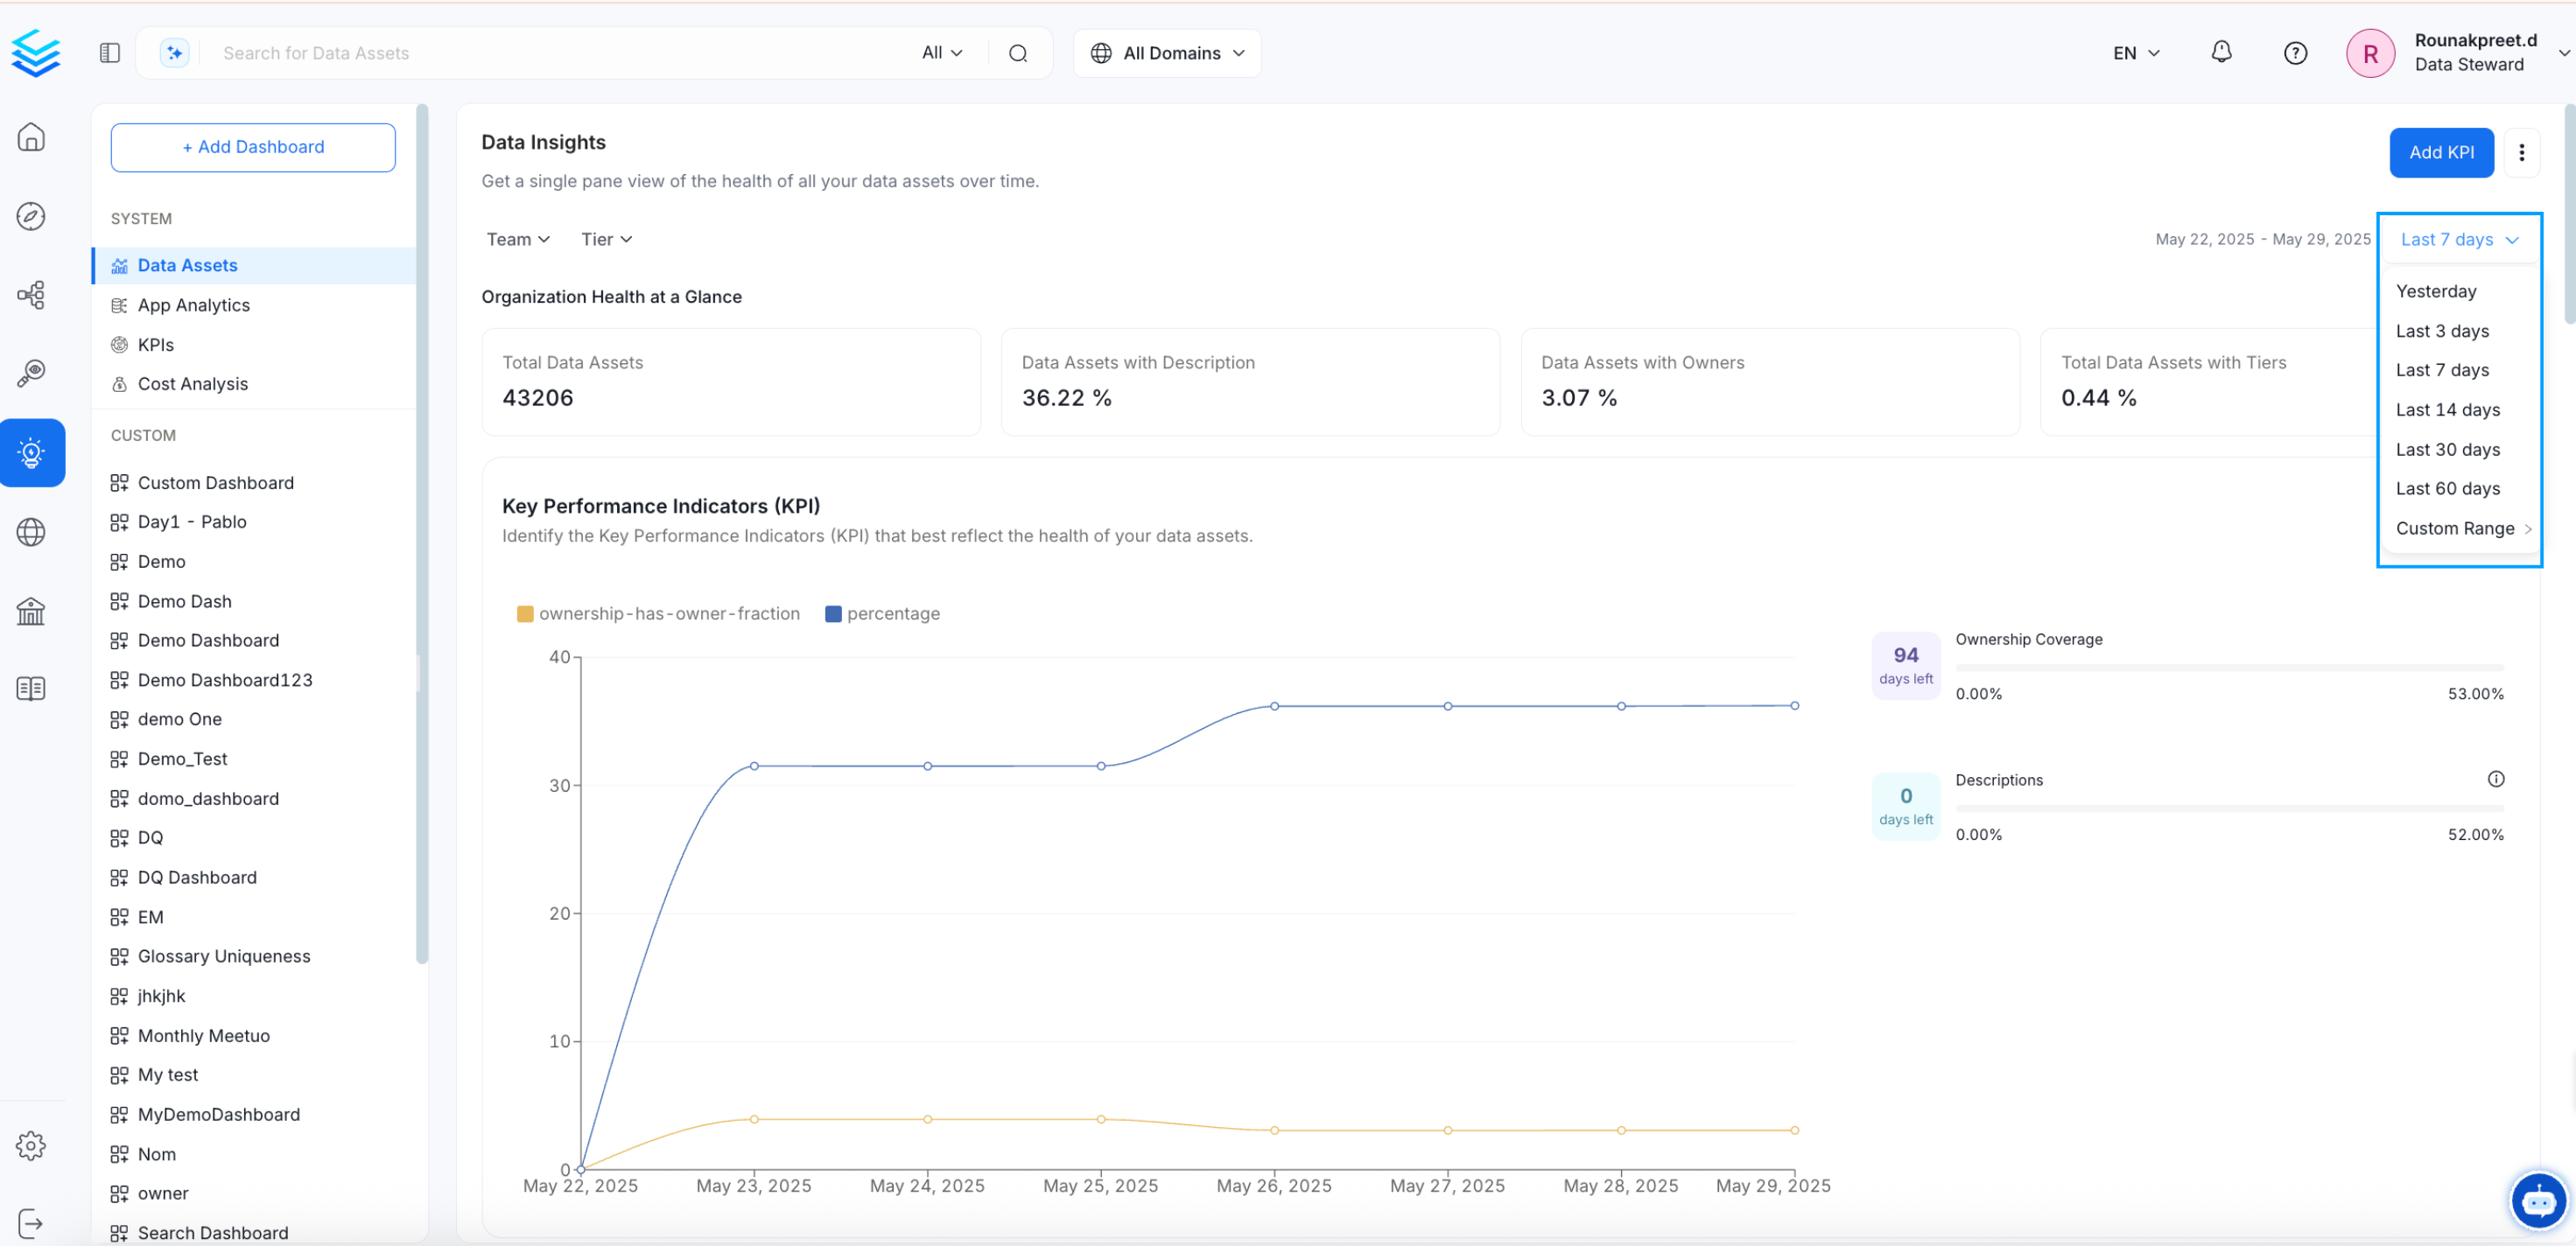
Data Insights Report Filter: Time
Data Assets Report
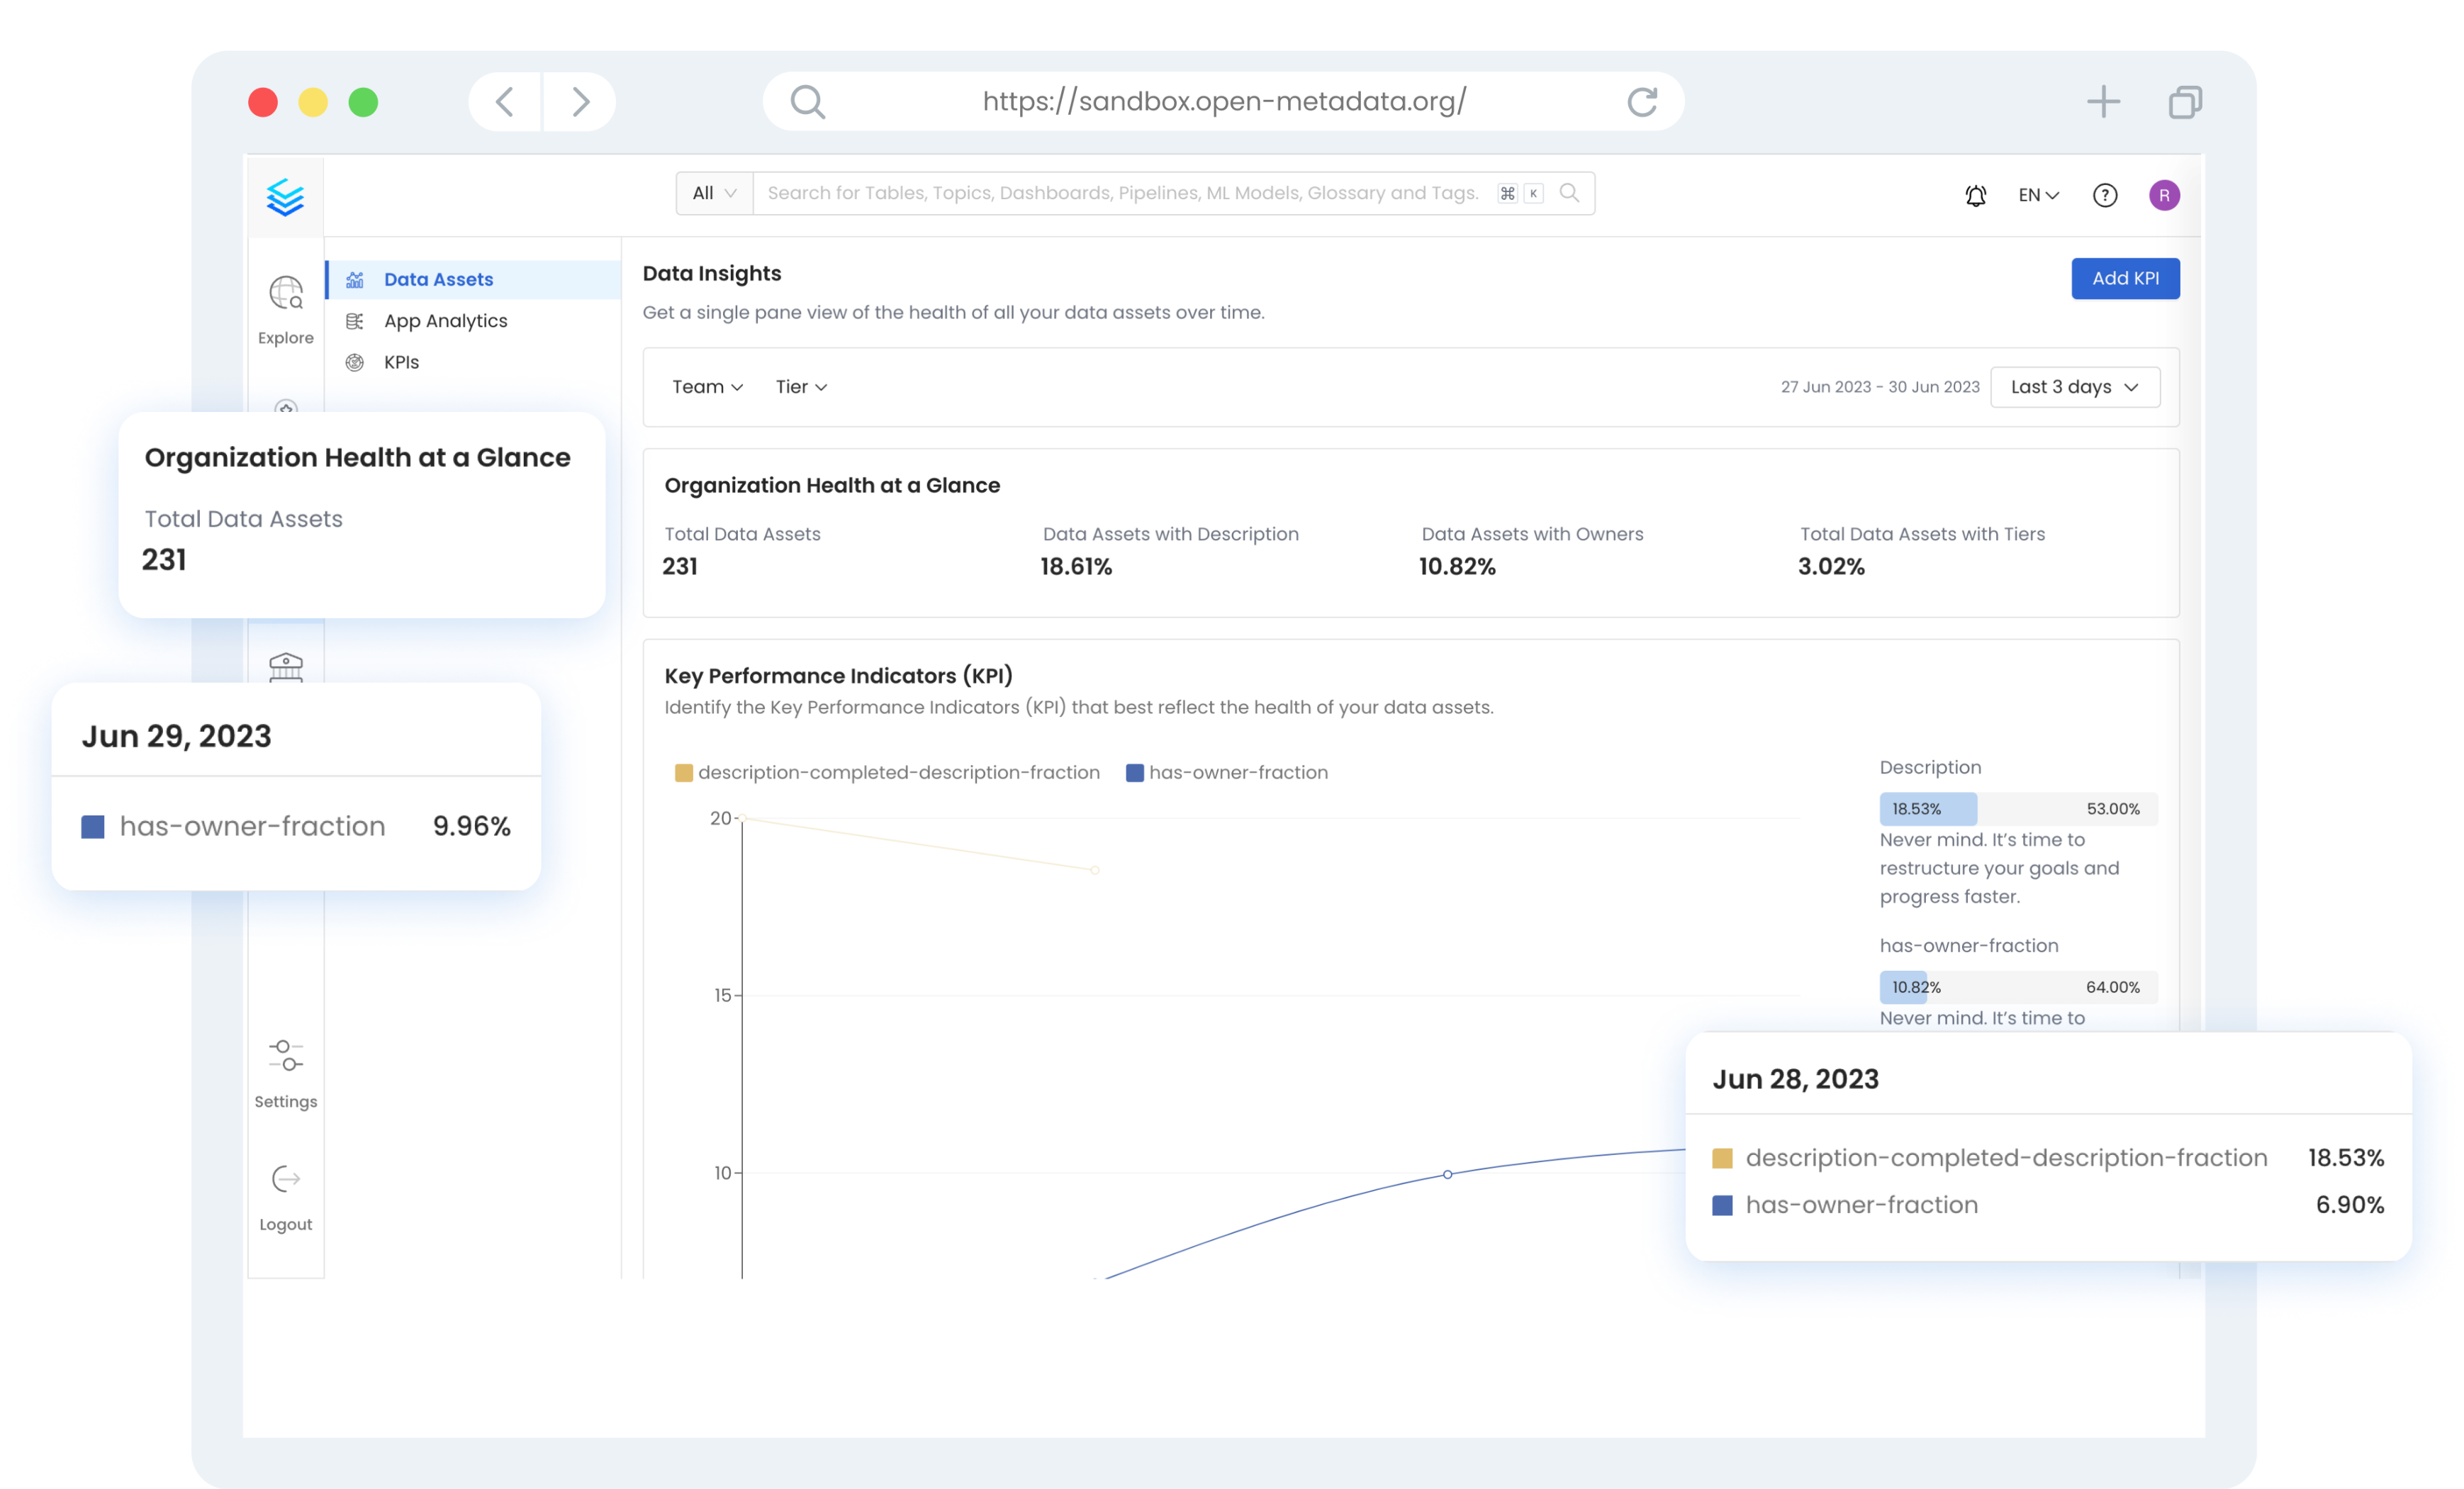
The Data Asset reports display important metrics around your data assets in OpenMetadata. This report also displays the organizational health at a glance with details on the Total Data Assets, Data Assets with Description, Owners, and Tiers.
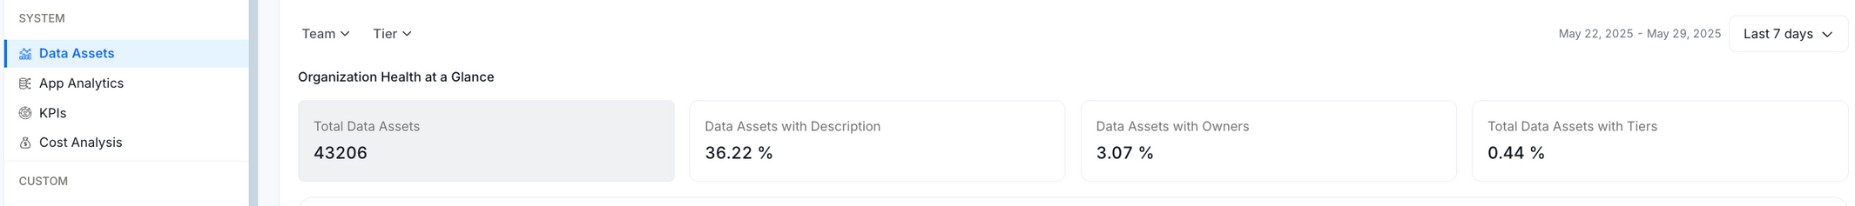
Organization Health at a Glance
Total Data Assets
This chart represents the total number of data assets present in OpenMetadata. It offers a view of your data assets broken down by asset type (i.e. DatabaseSchema, Database, Dashboard, Chart, Topic, ML Model, etc.)
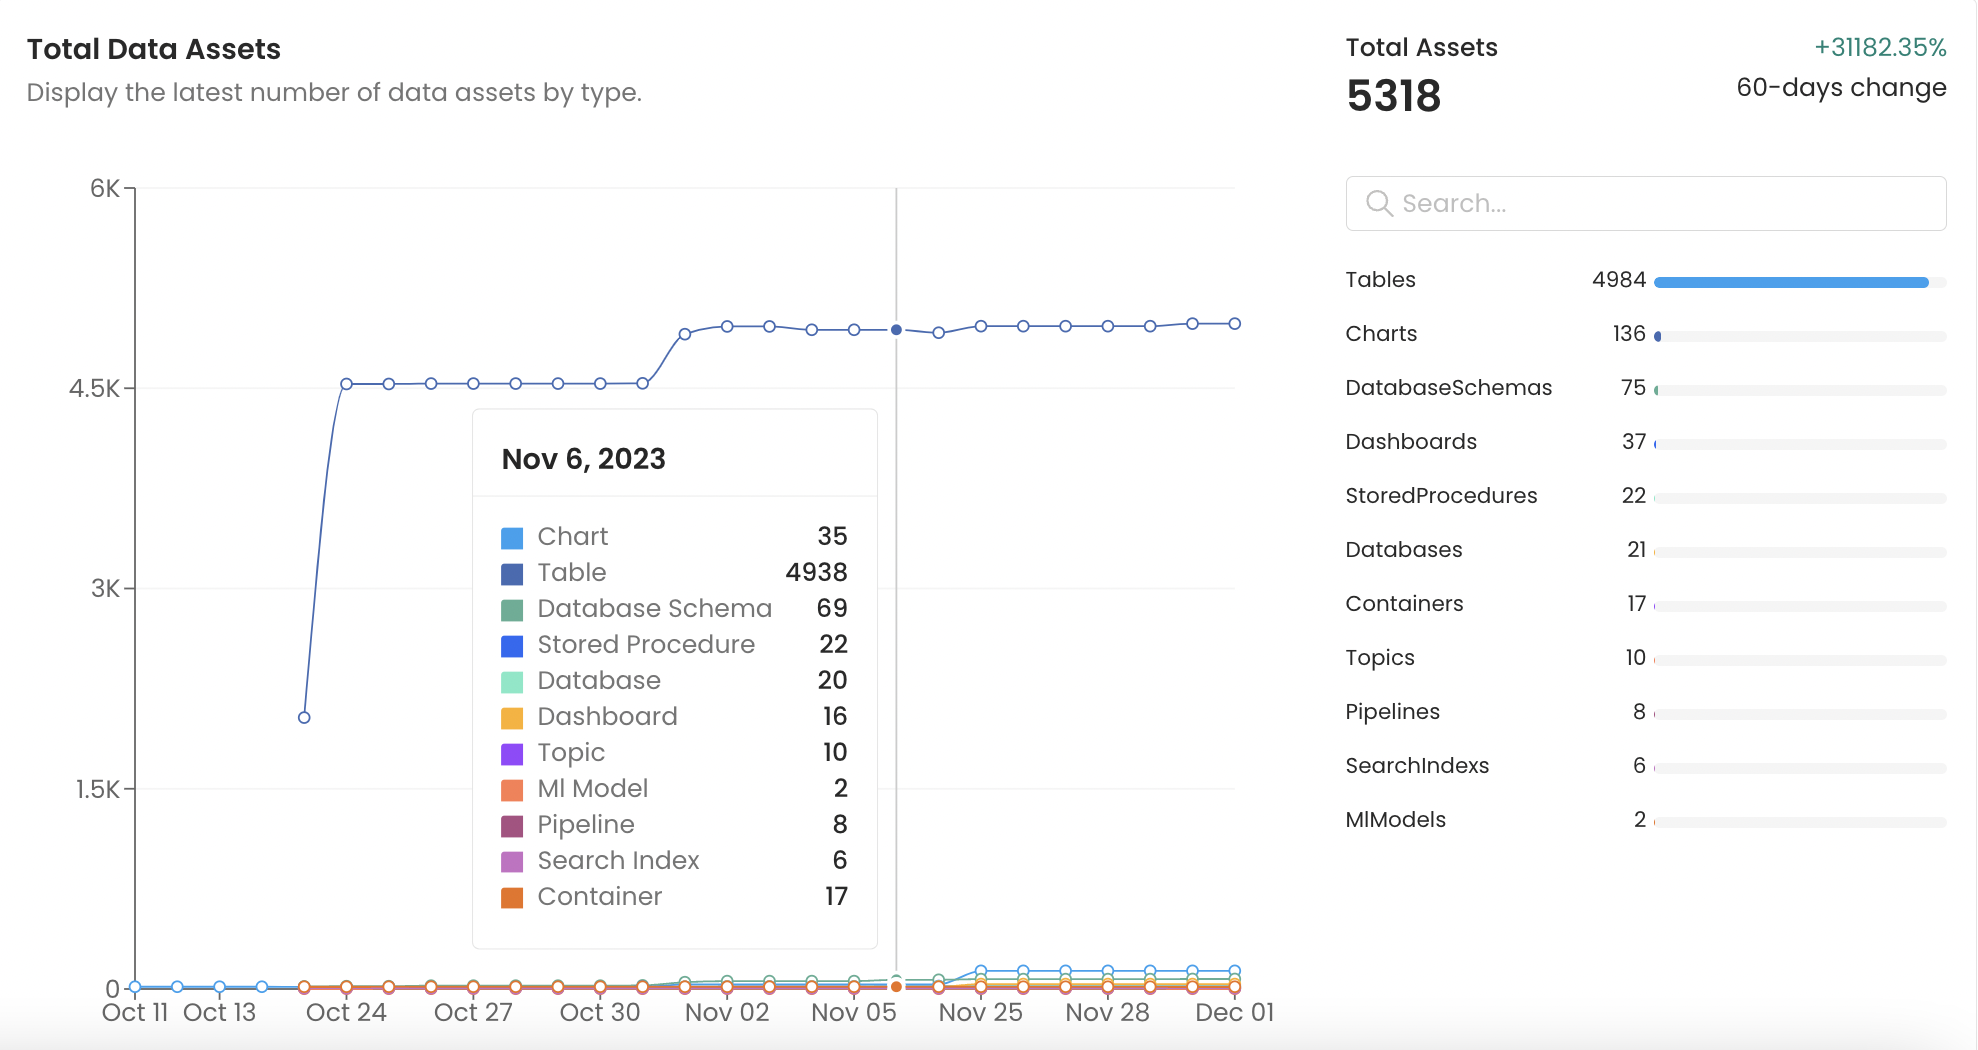
Total Data Assets
Percentage of Data Assets with Description
It displays the percentage of data assets with description by data asset type. For Table asset type, this condition is true only if the table and column description are filed. It allows you to quickly view the description coverage for your data assets in OpenMetadata.
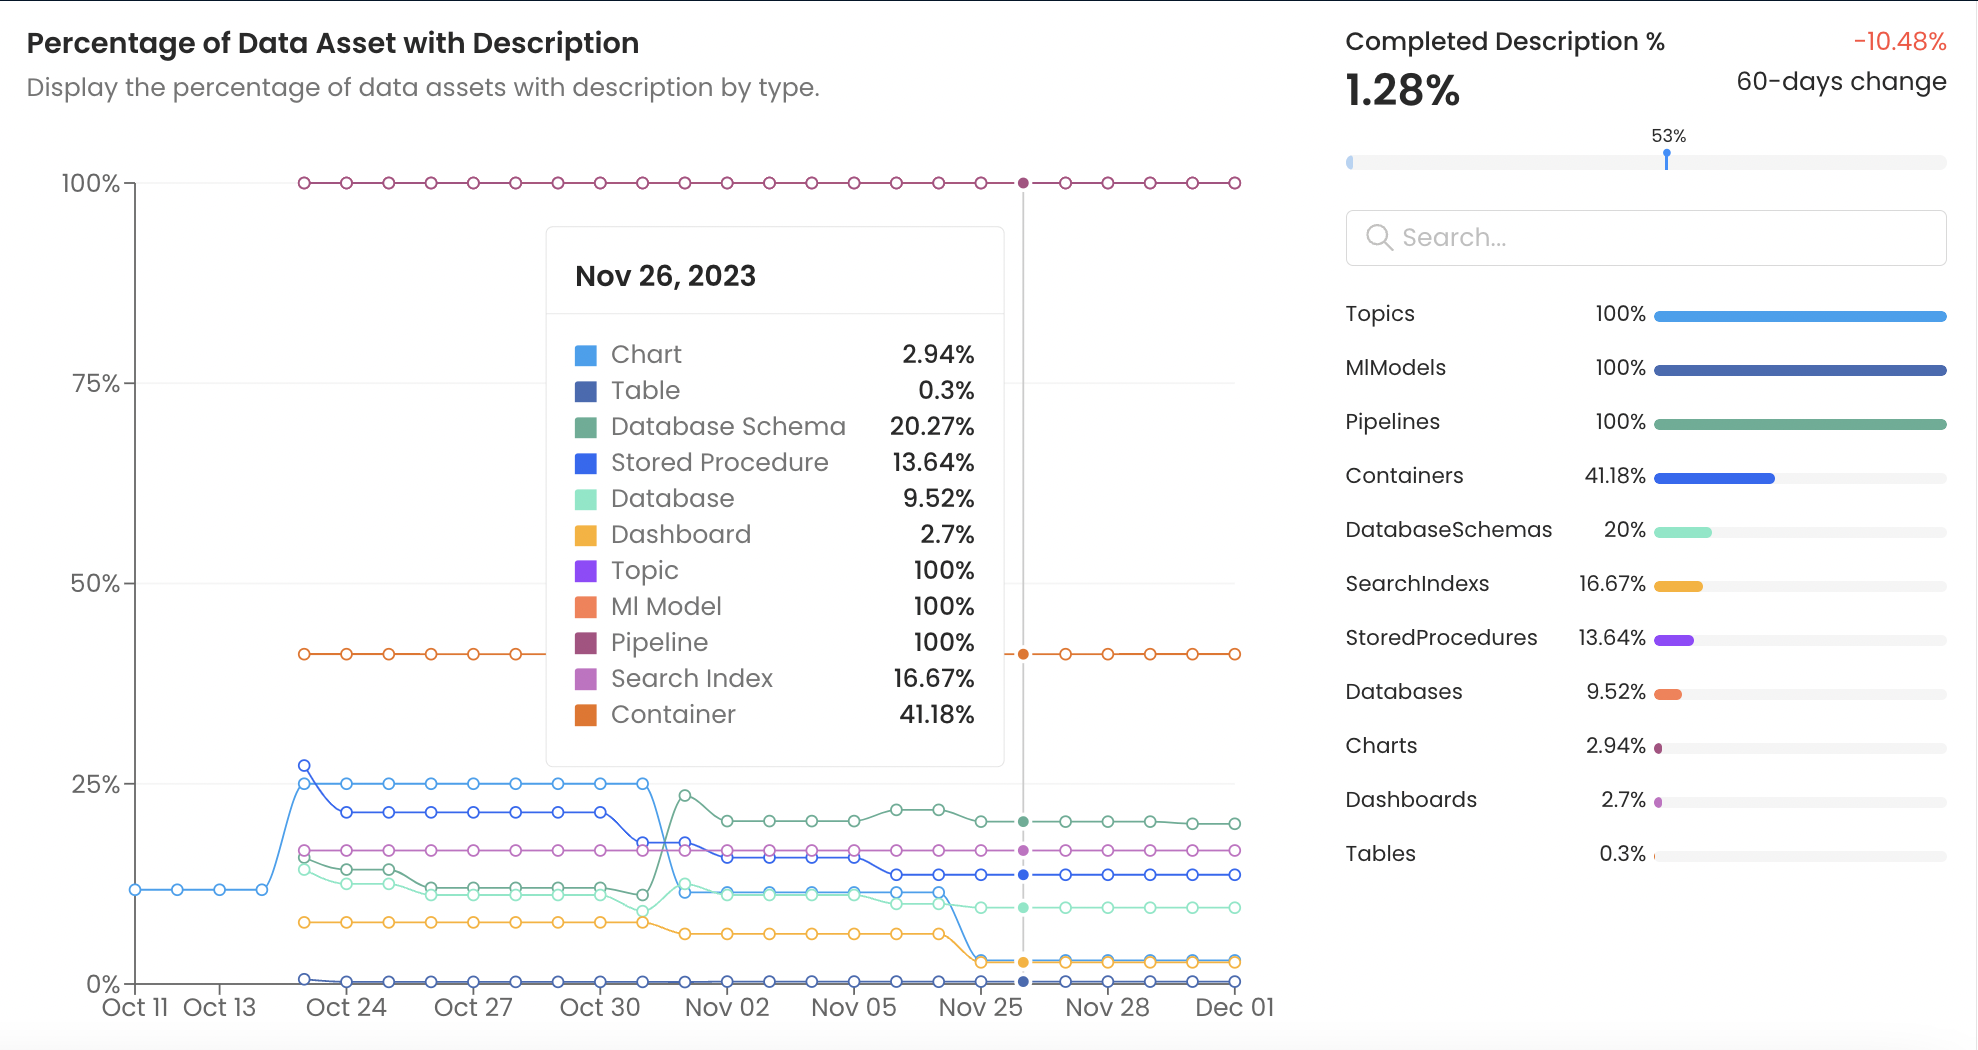
Percentage of Data Assets with Description
Percentage of Data Assets with Owners
This chart represents the percentage of data assets present in OpenMetadata with an owner assigned. Data assets that do not support assigning an owner will not be counted in this percentage. It allows you to quickly view the ownership coverage for your data assets in OpenMetadata.
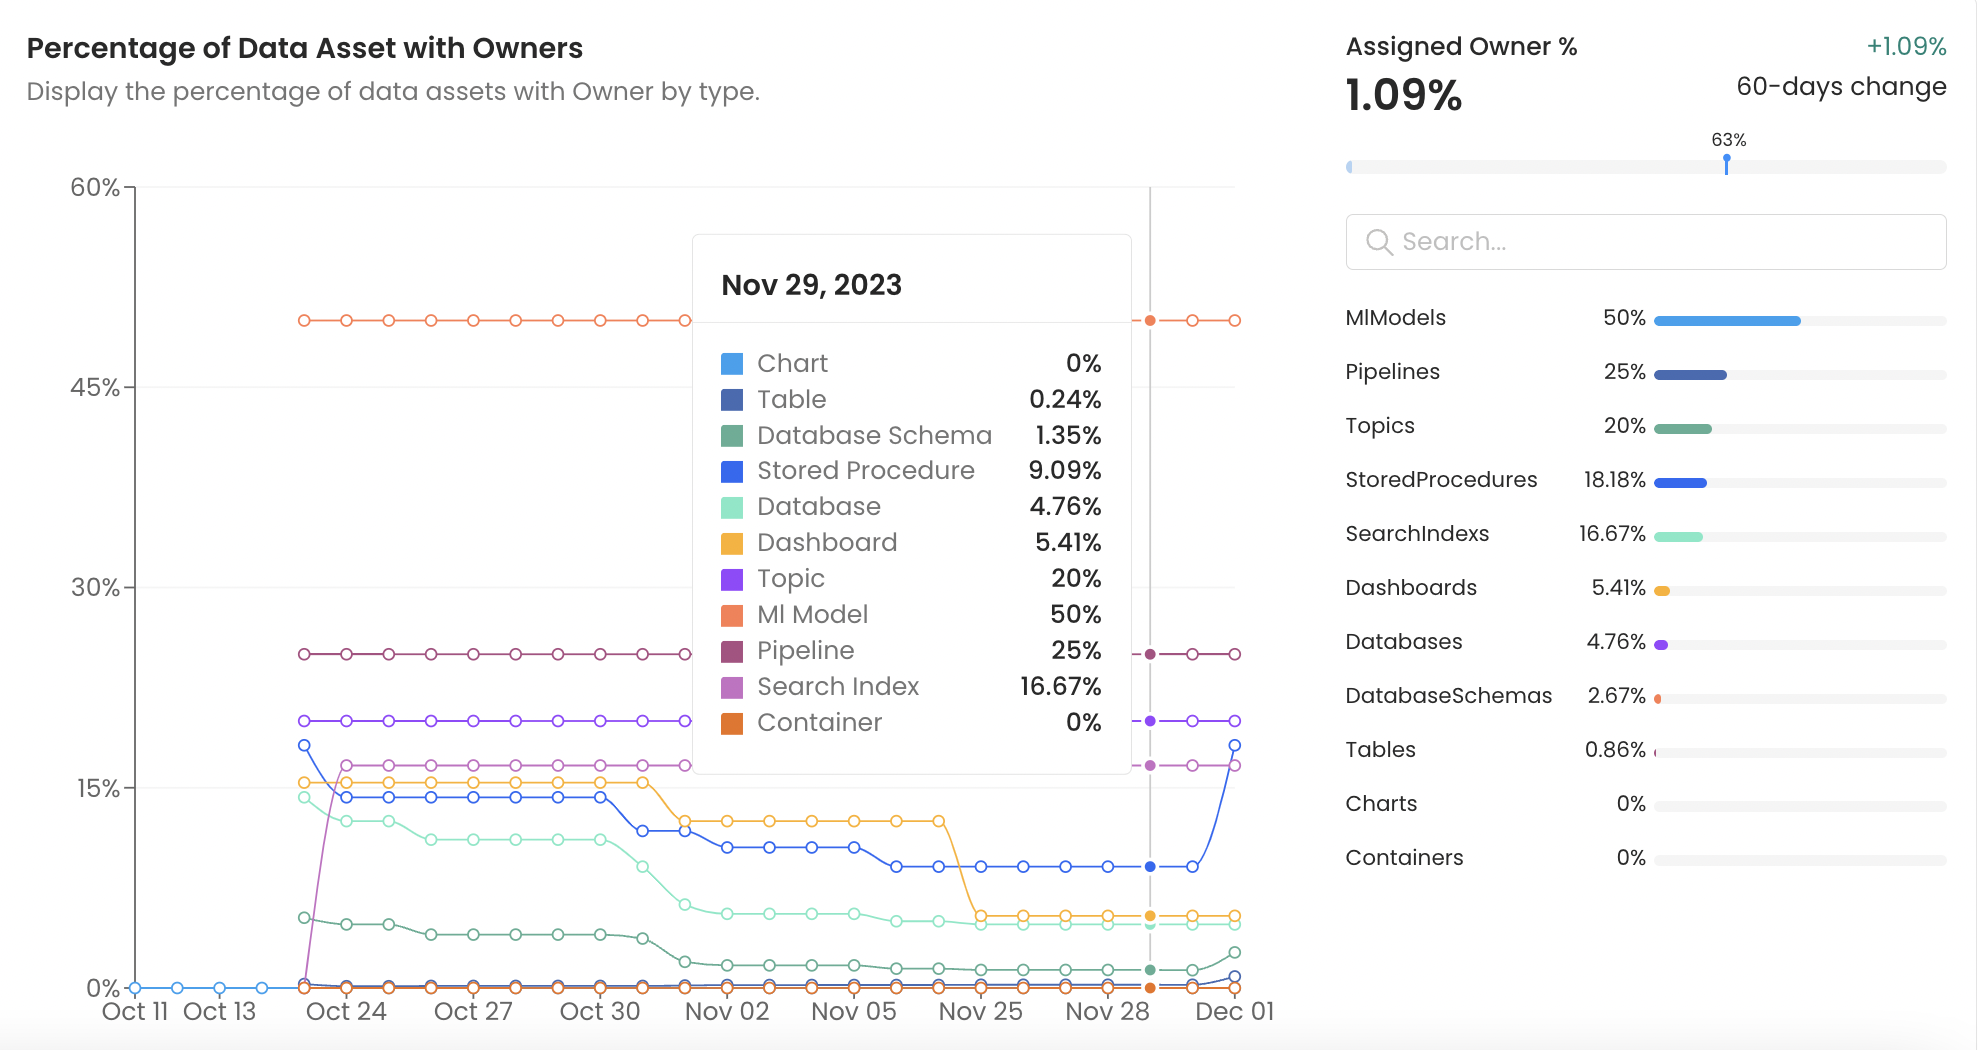
Percentage of Data Assets with Owners
Percentage of Service with Description
This chart displays the percentage of data assets with description as ingested from each service. The search filter helps to narrow down the results and look for information by the required services.
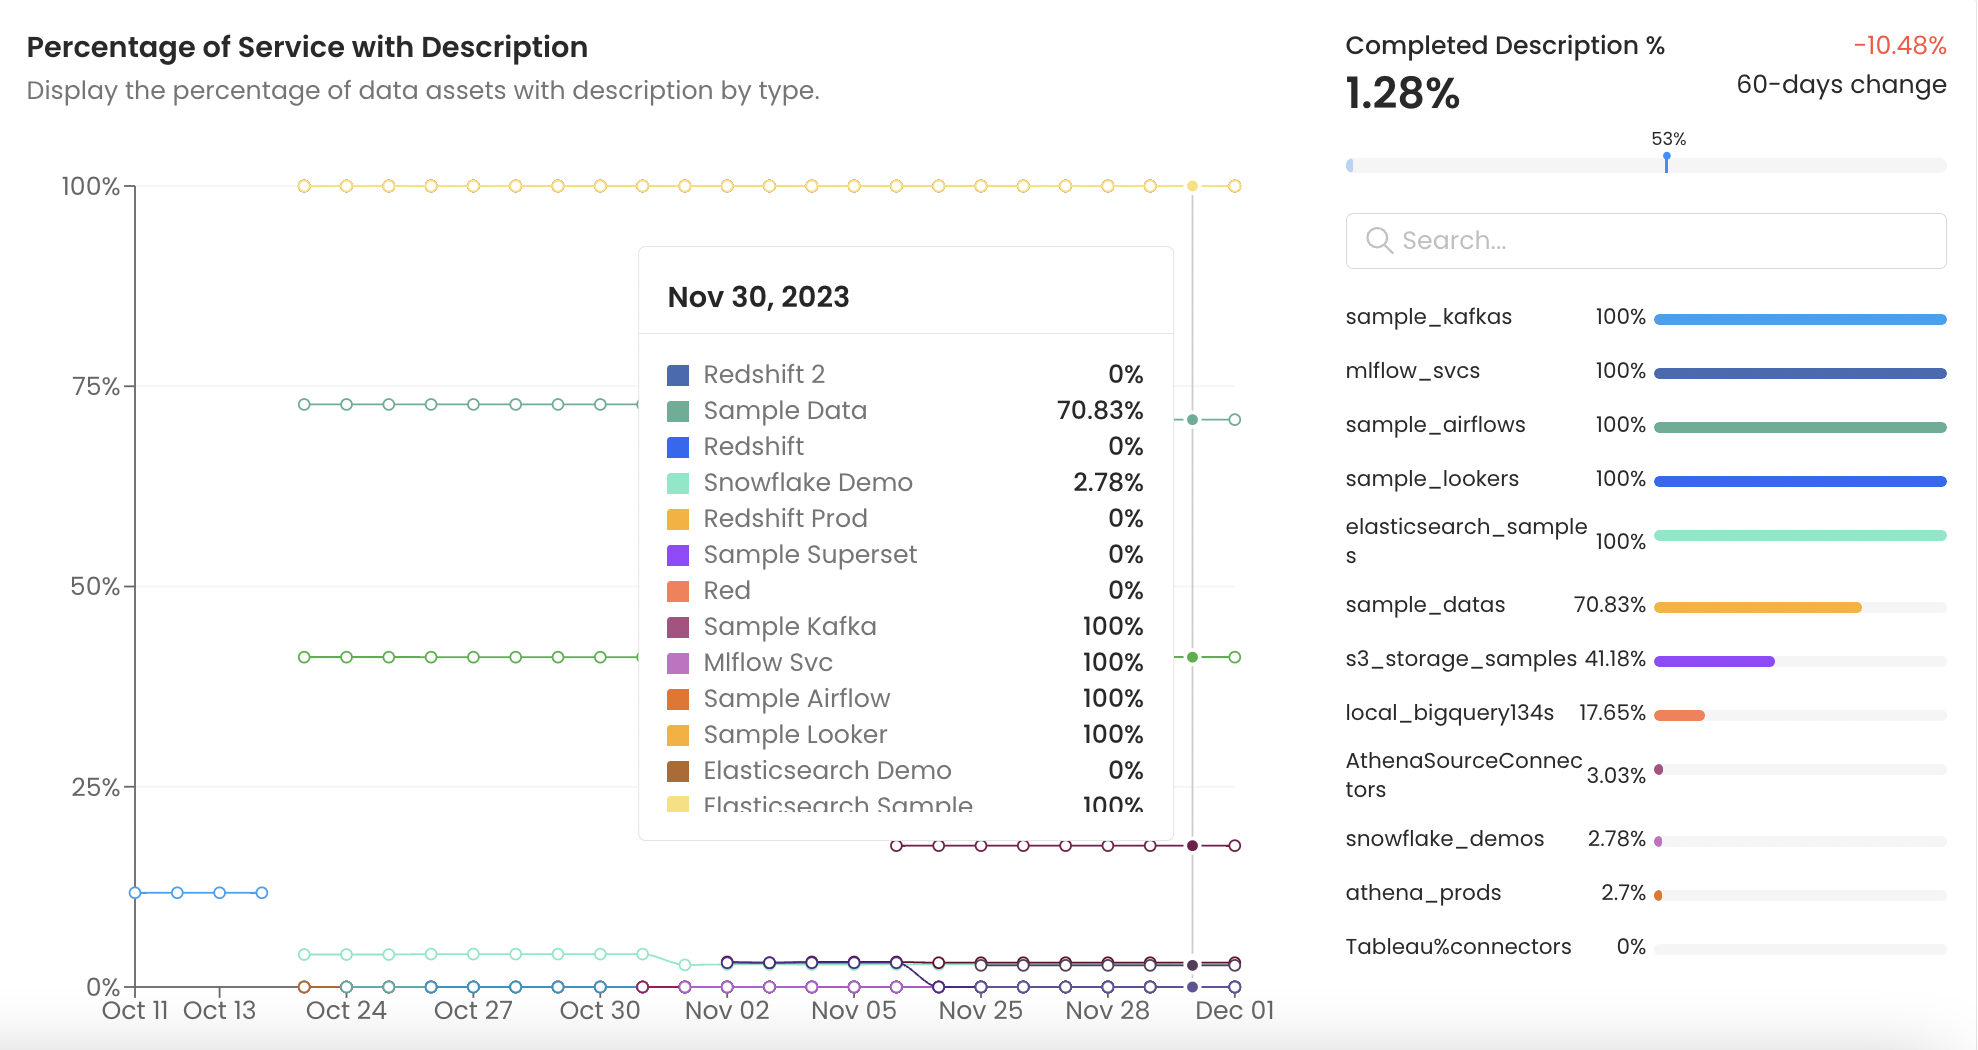
Percentage of Service with Description
Percentage of Service with Owners
This chart displays the percentage of data assets with Owners as ingested from each service. The search filter helps to narrow down the results and look for information by the required services.
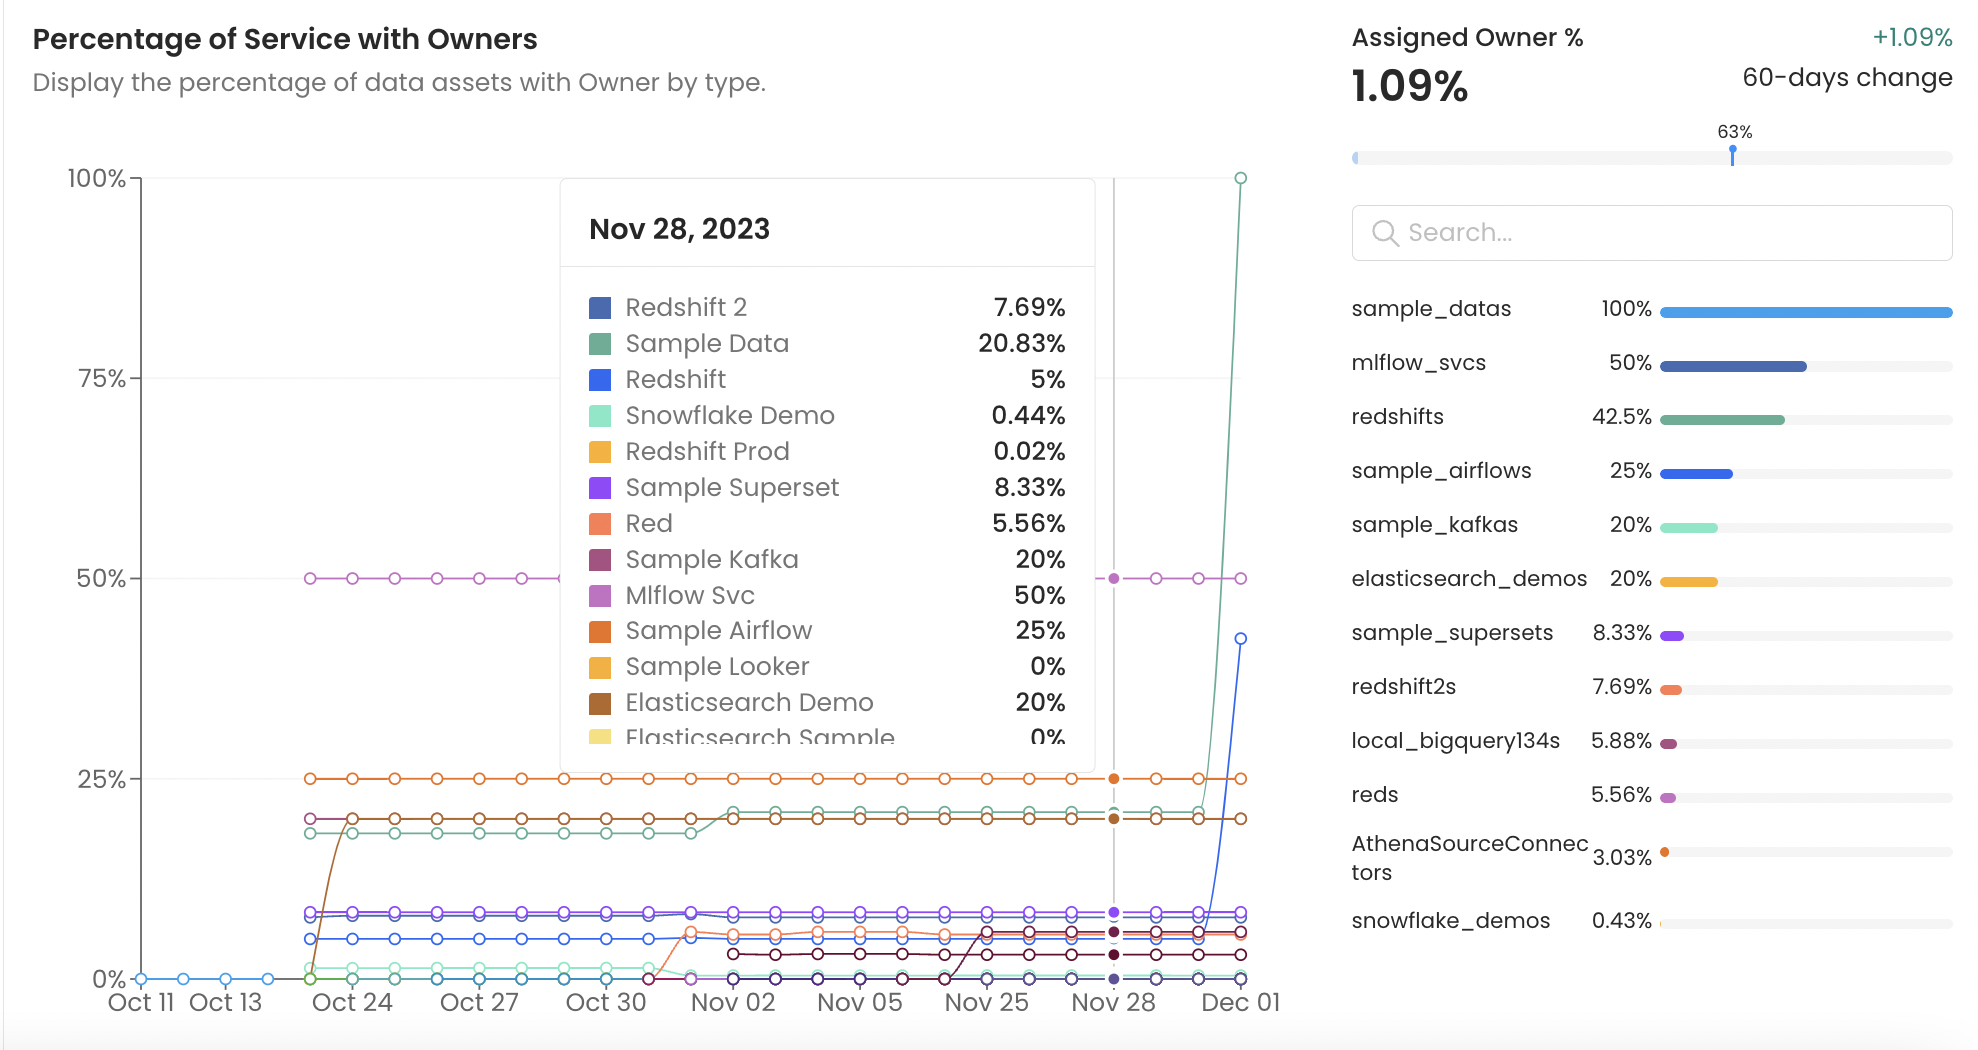
Percentage of Service with Owners
Total Data Assets by Tier
It displays a broken down view of data assets by Tiers. Data Assets with no tiers assigned are not included in this. It allows you to quickly view the breakdown of data assets by tier.
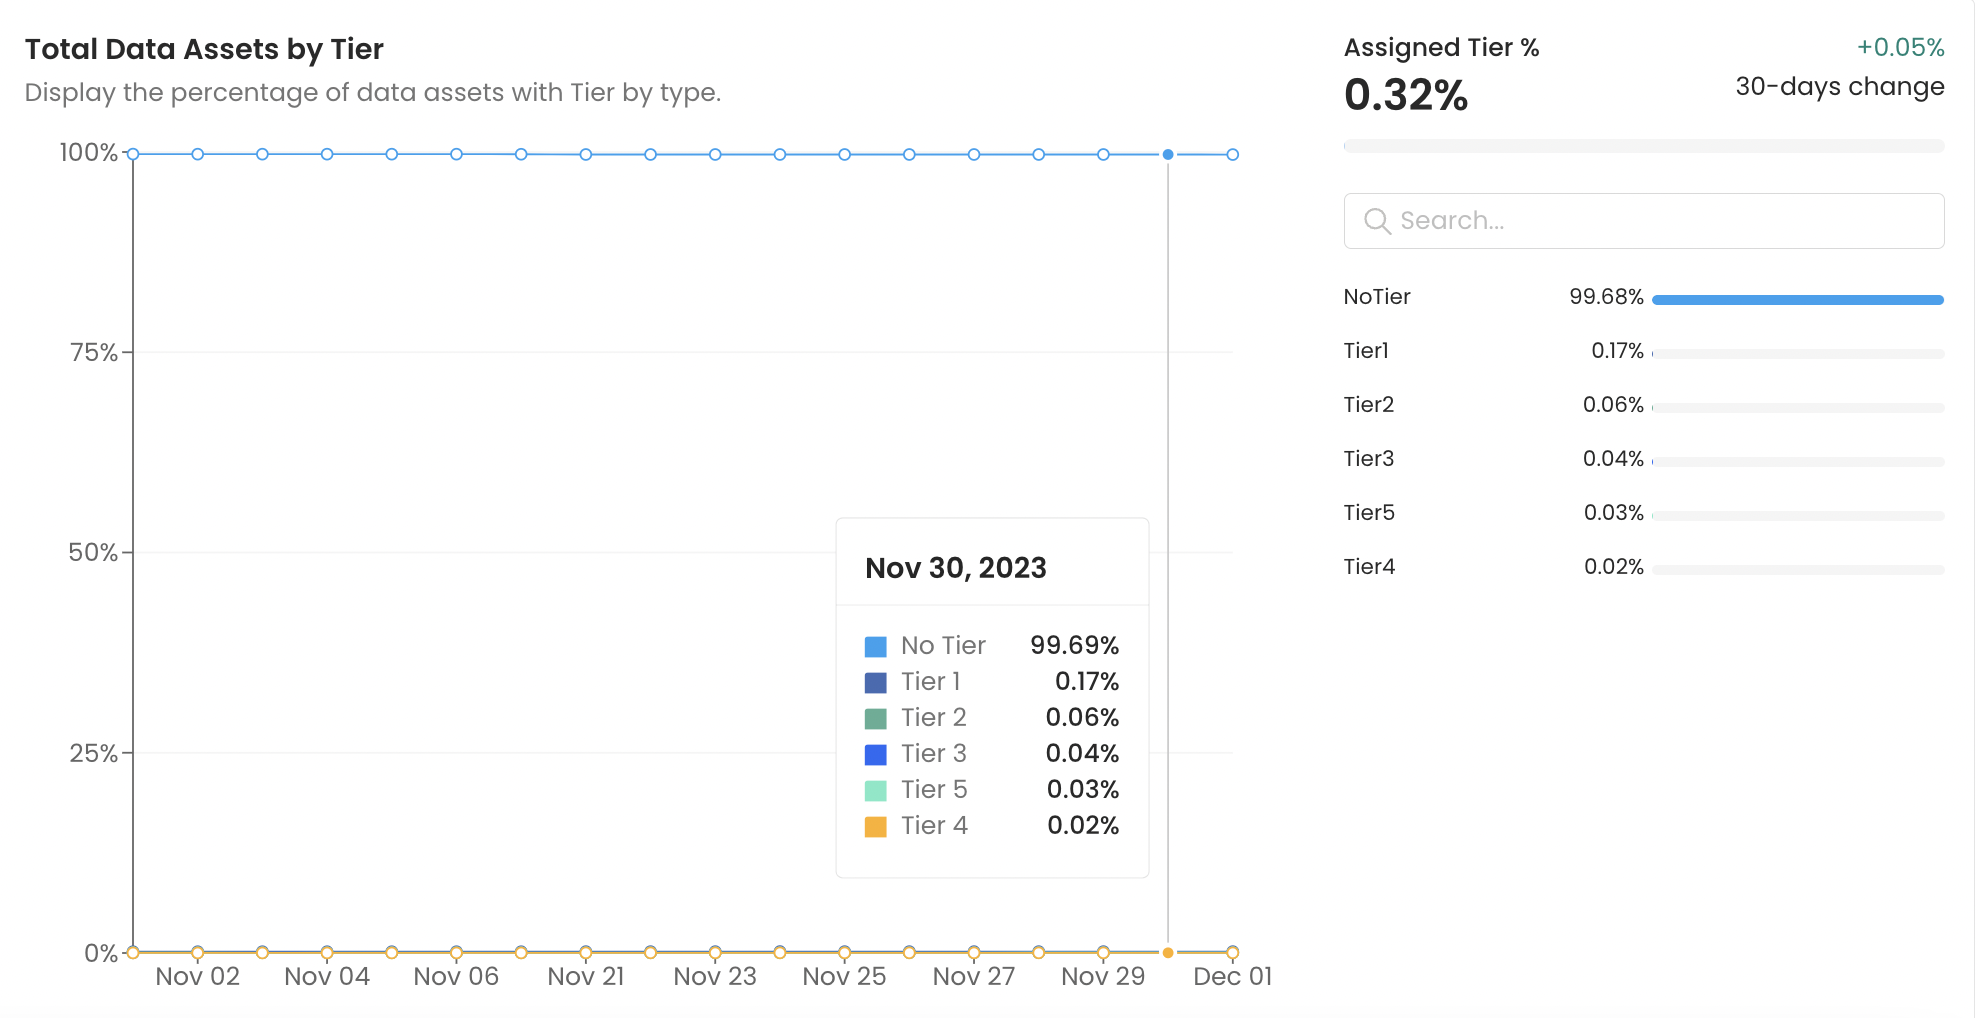
Total Data Assets by Tier
App Analytics
App analytics helps to track user engagement. This report provides important metrics around the usage of OpenMetadata. This report also displays the organizational health at a glance with details on the Page Views by Data Assets, Daily Active Users on the Platform, and the Most Active User.
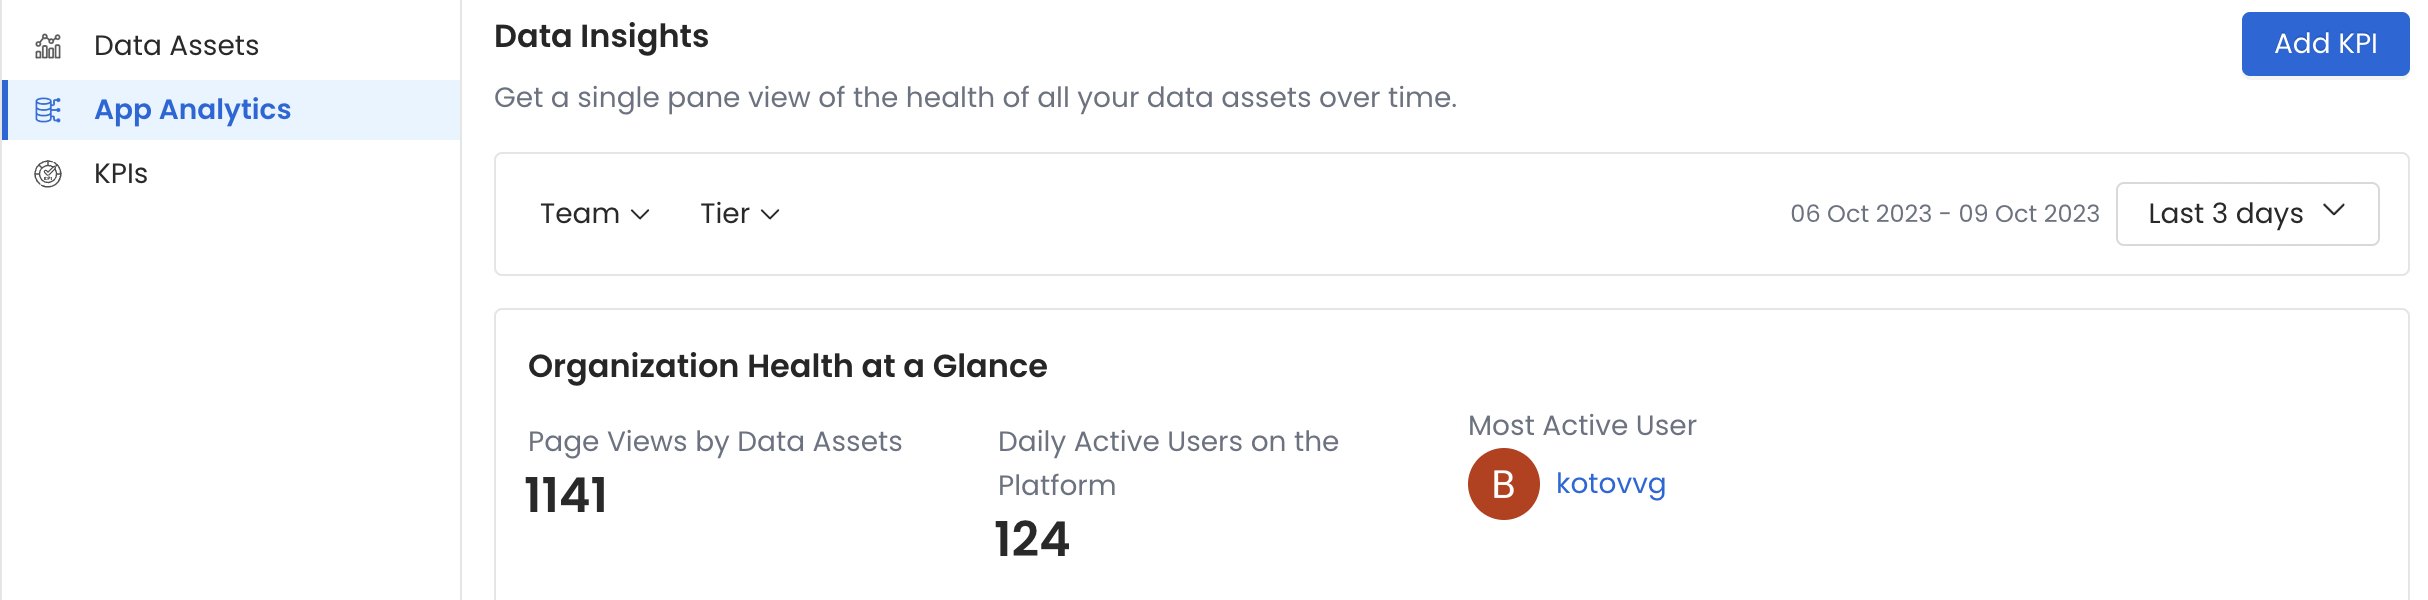
Organization Health at a Glance
Most Viewed Data Assets
Know the 10 most viewed data assets in your platform. It offers a quick view to identify the data assets of the most interest in your organization.
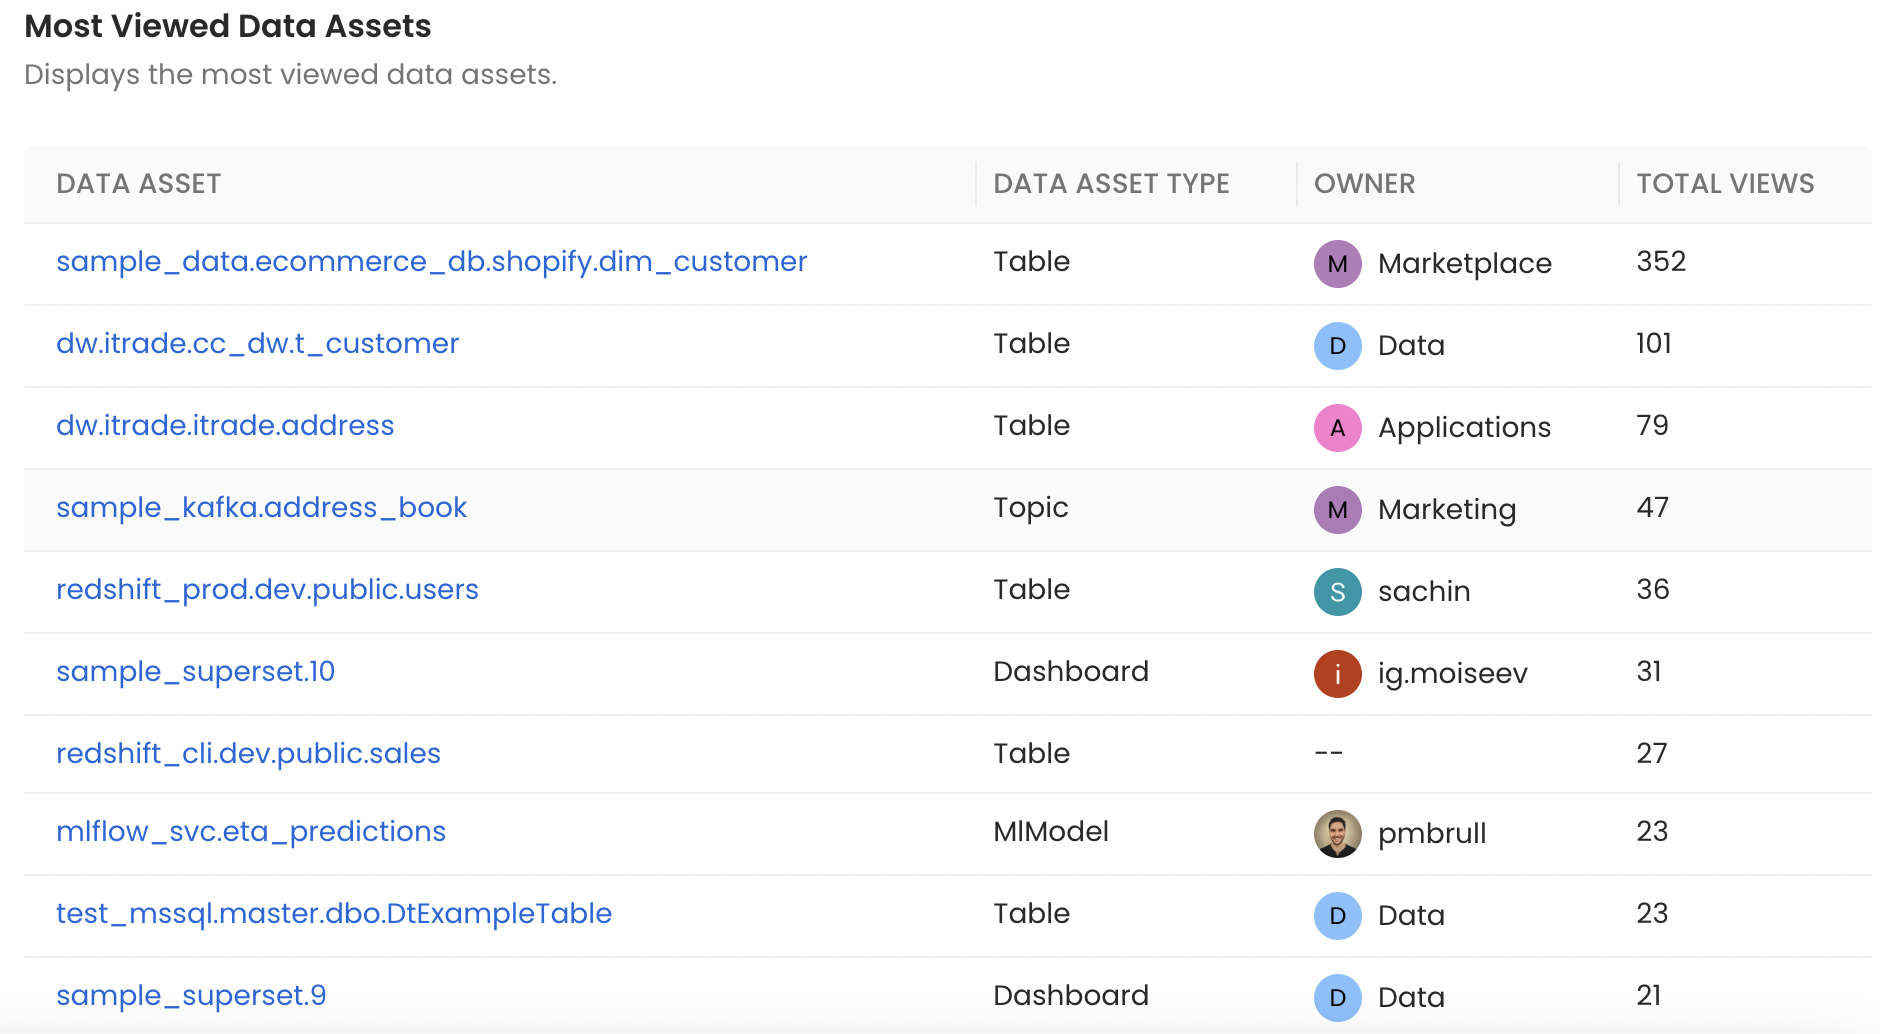
Most Viewed Data Assets
Page Views by Data Assets
It helps to understand the total number of page views by asset type. This allows you to understand which asset family drives the most interest in your organization
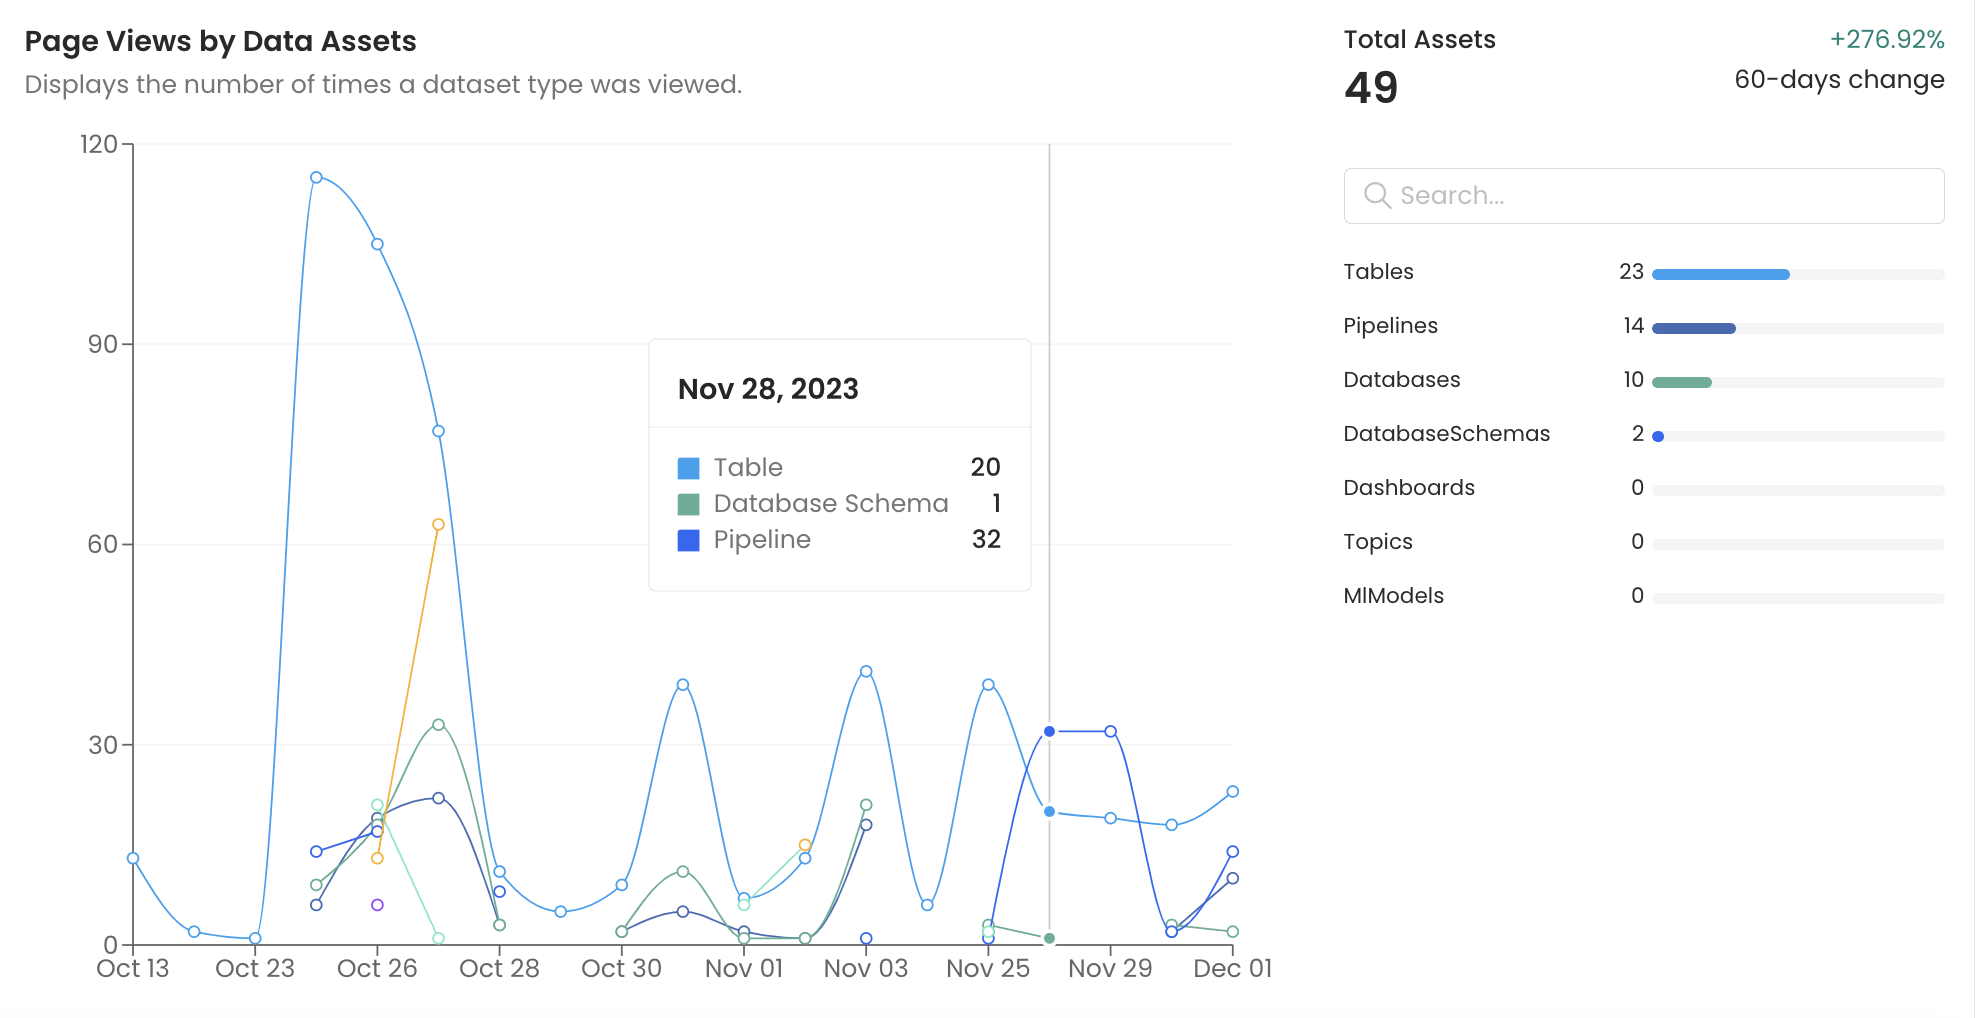
Page Views by Data Assets
Daily Active Users on the Platform
Active users are users with at least one session. This report allows to understand the platform usage and see how your organization leverages OpenMetadata.
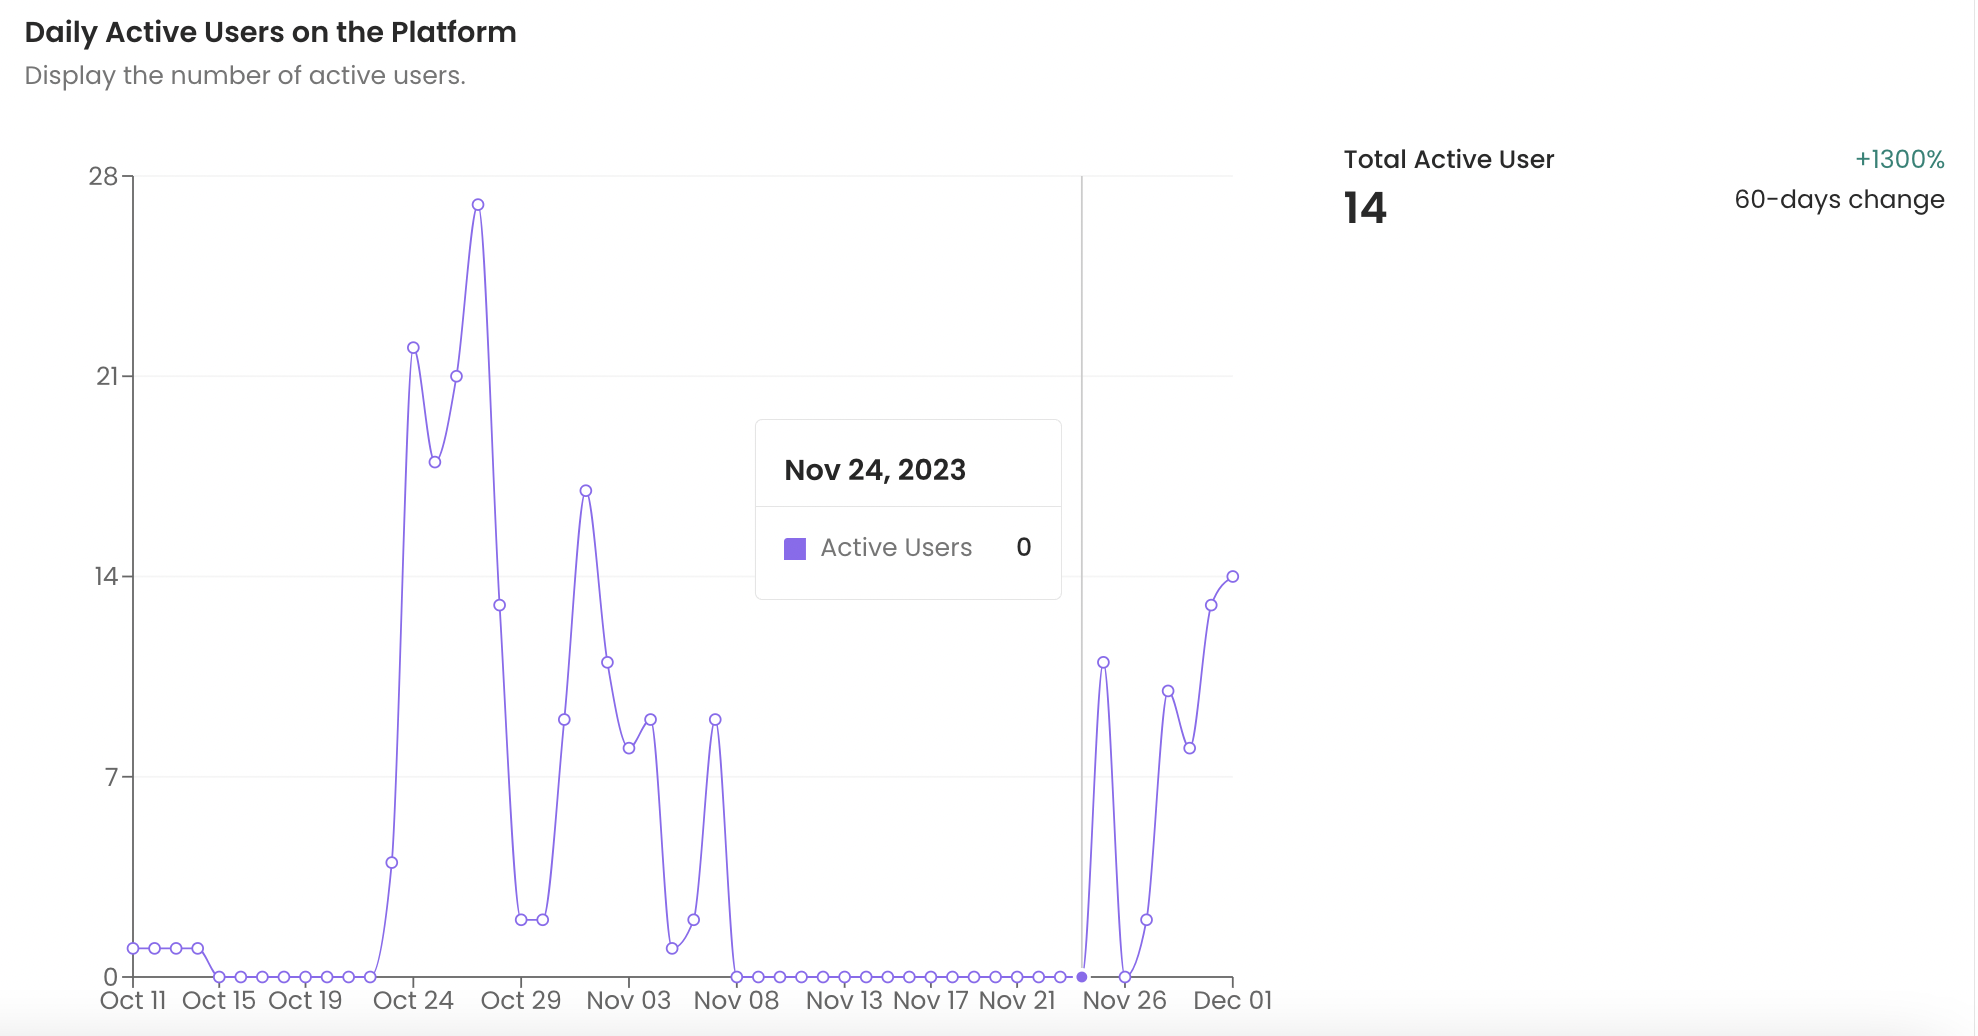
Daily Active Users on the Platform
Most Active Users
This report displays the most active users on the platform based on Page Views. They are the power users in your data team.
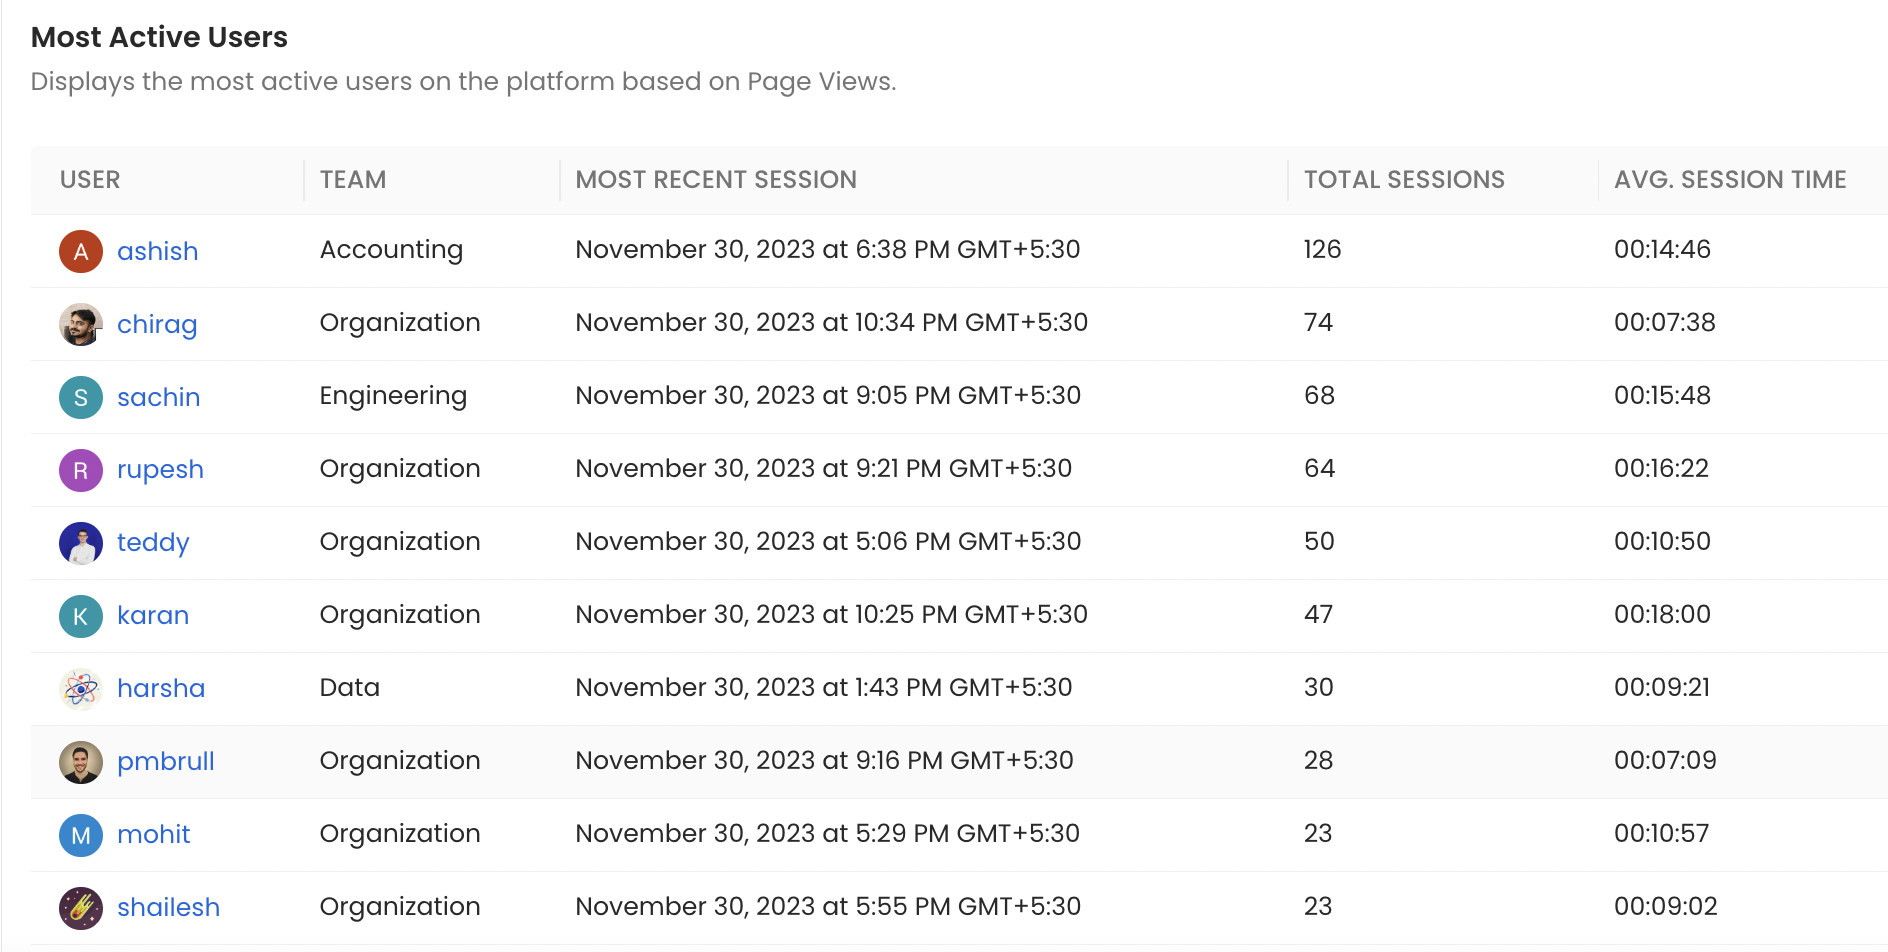
Most Active Users
Key Performance Indicators (KPI)
While data insights reports gives an analytical view of the OpenMetadata platform, KPIs are here to drive platform adoption. The below report displays the percentage coverage of description and ownership of the data assets.
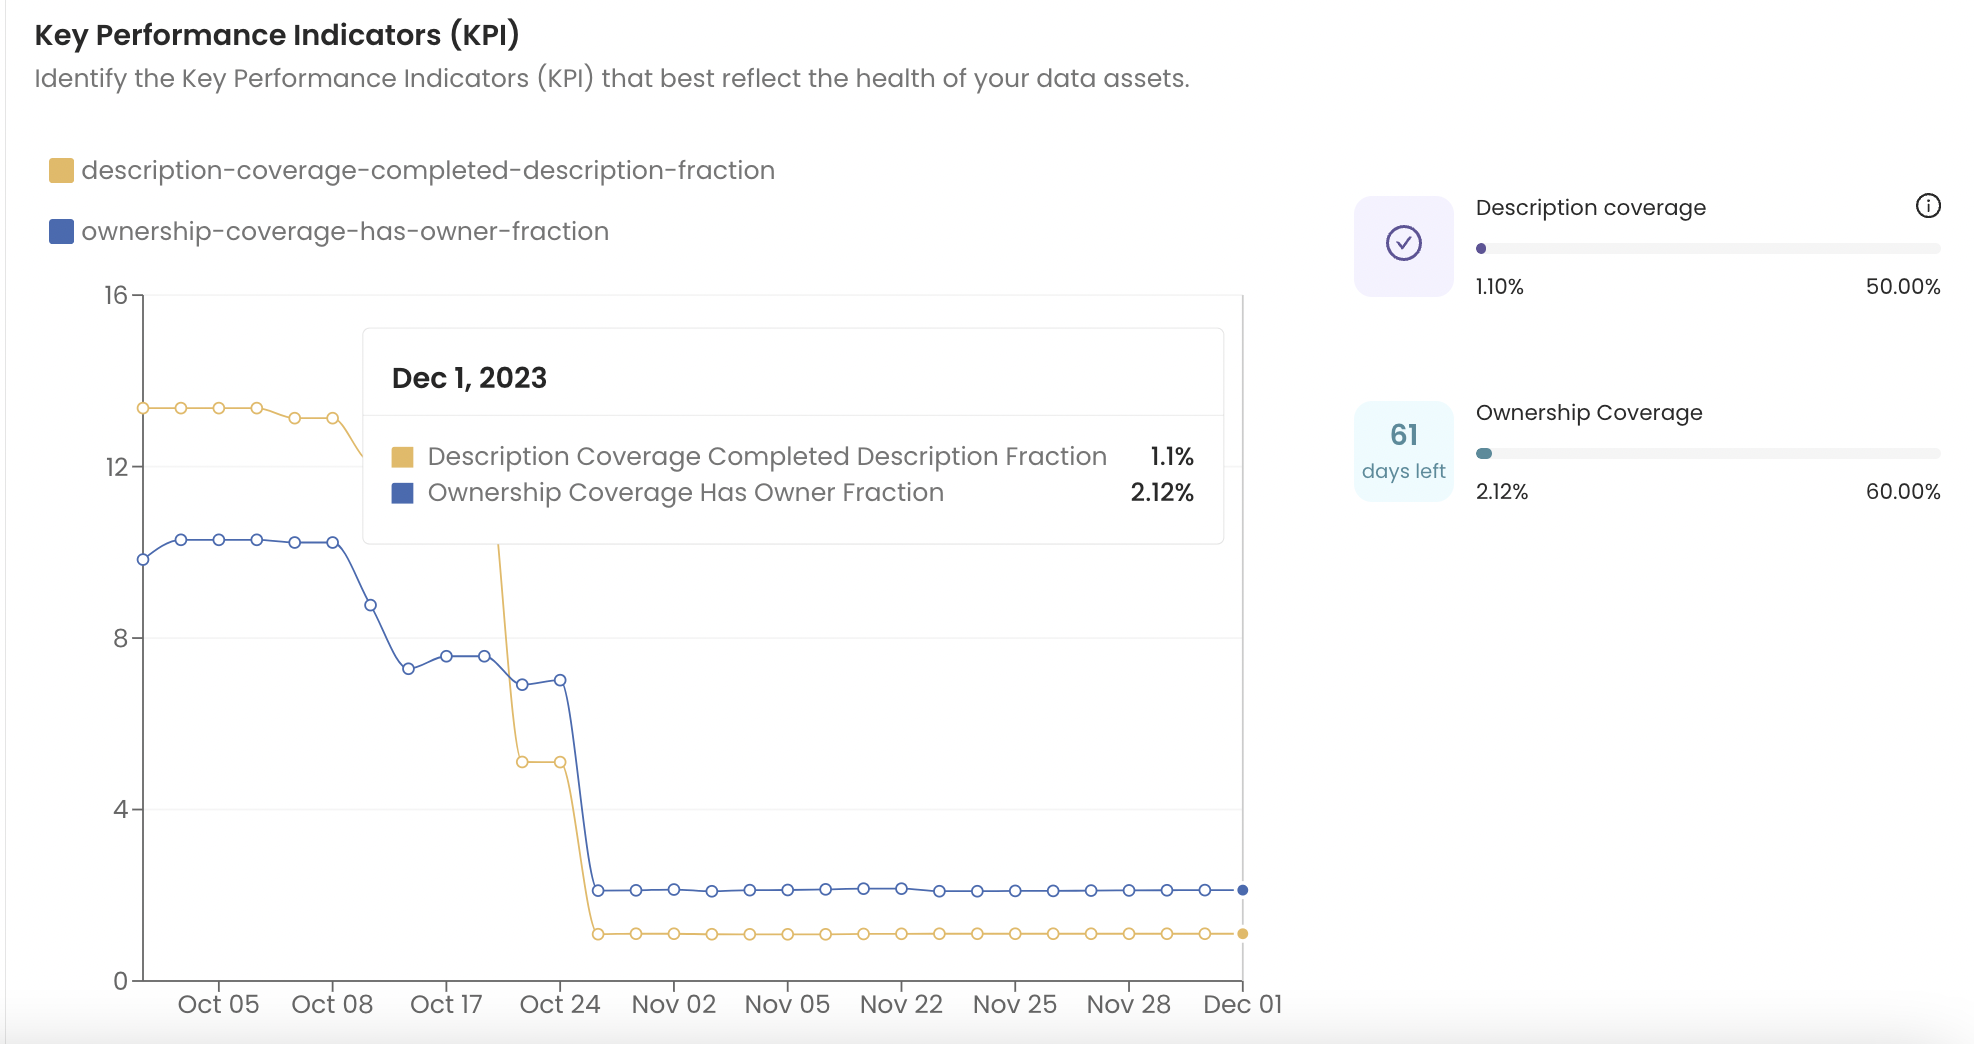
Key Performance Indicators (KPI)
Cost Analysis (Collate only)
These reports are displayed for Collate SaaS users. A lot of money is invested into data infrastructure and data teams to make smarter decisions and ultimately grow one's business. The Cost Analysis report helps to figure out the ROI on these data initiatives, and to know if the company’s efforts in data are paying off or not and to eliminate unnecessary costs.
Used vs Unused Assets Count
This report points out which data assets are getting a lot of use and which ones are not.
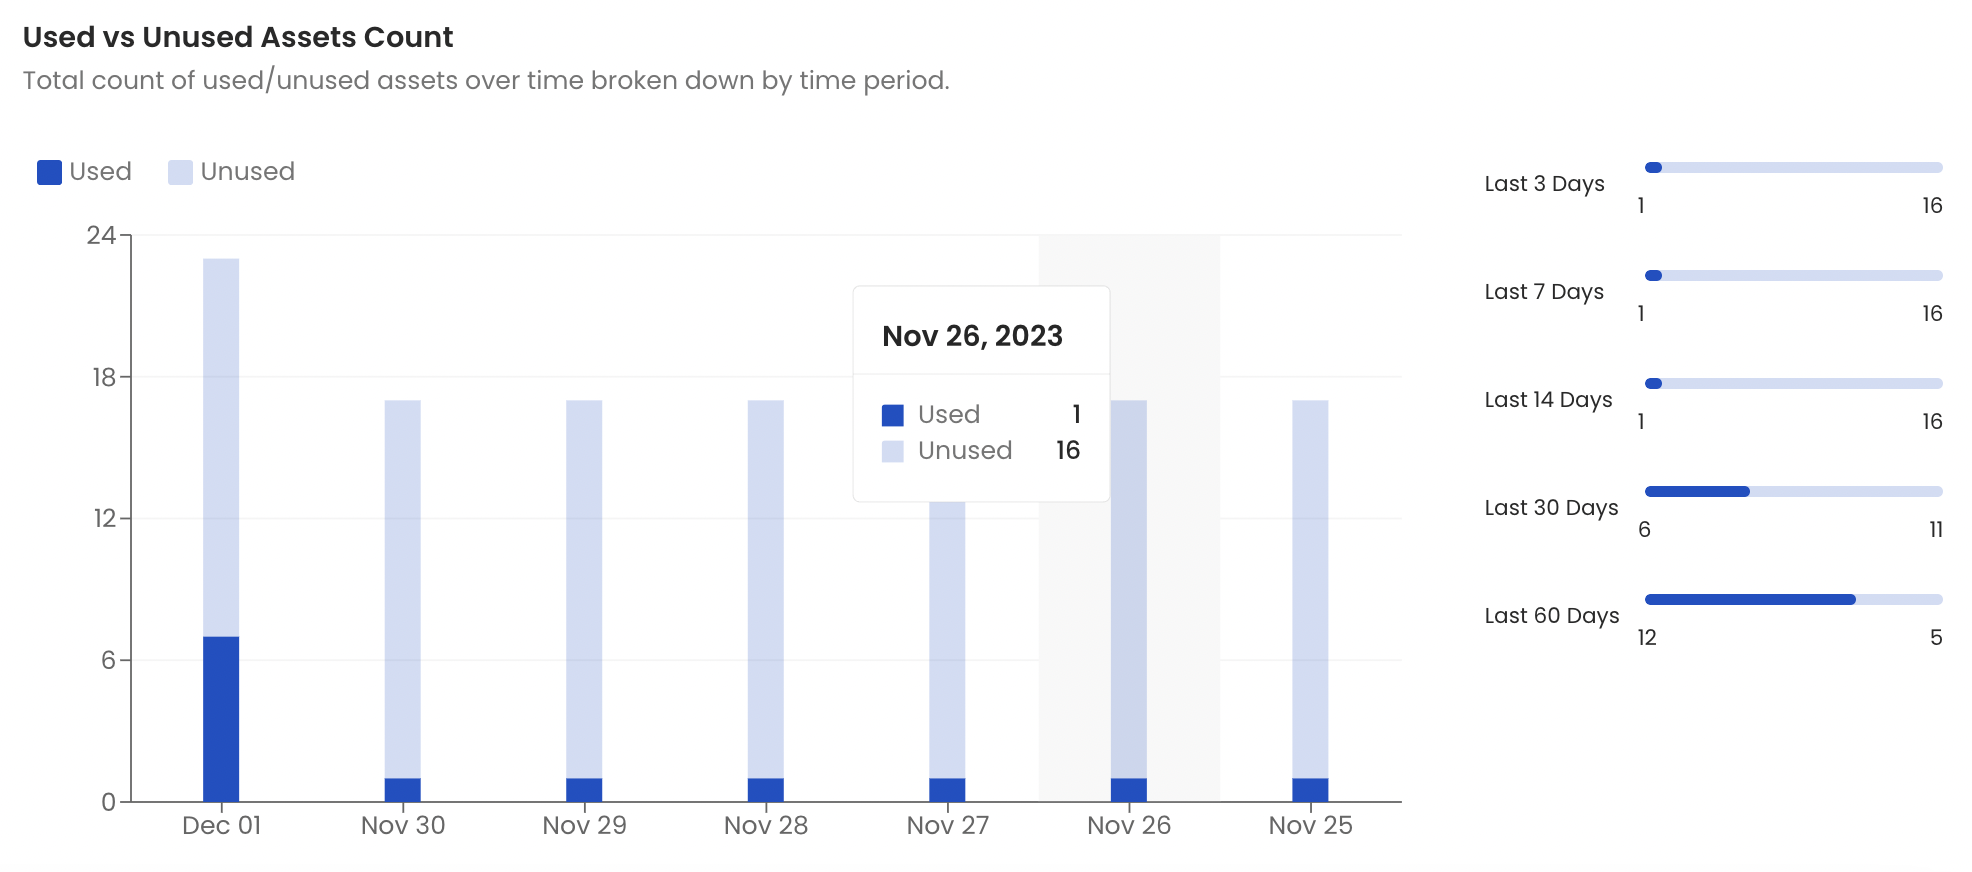
Used vs Unused Assets Count
Used vs Unused Assets Size
This report displays how much data is being stored and how many terabytes of it are just taking up space without providing any real value.
Used vs Unused Assets Size Percentage
It displays the size of the used vs unused assets over time in percentage.
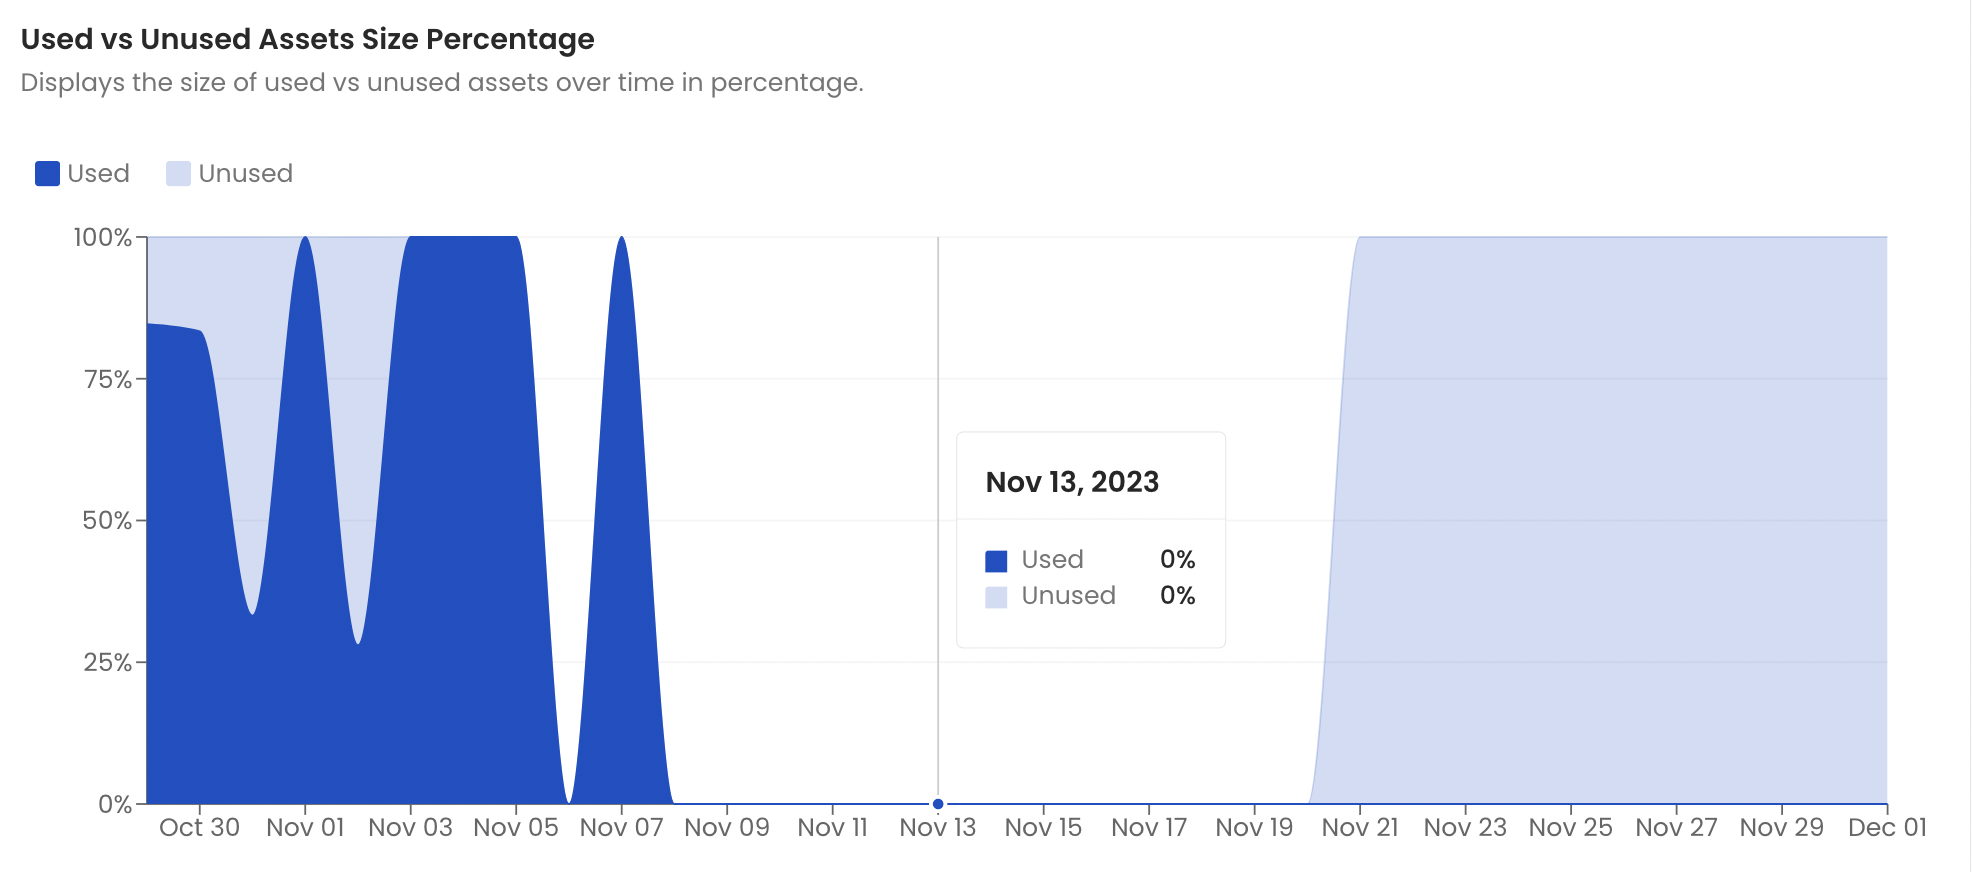
Used vs Unused Assets Size Percentage
Used vs Unused Assets Count Percentage
It displays the count of the used vs unused assets over time in percentage.
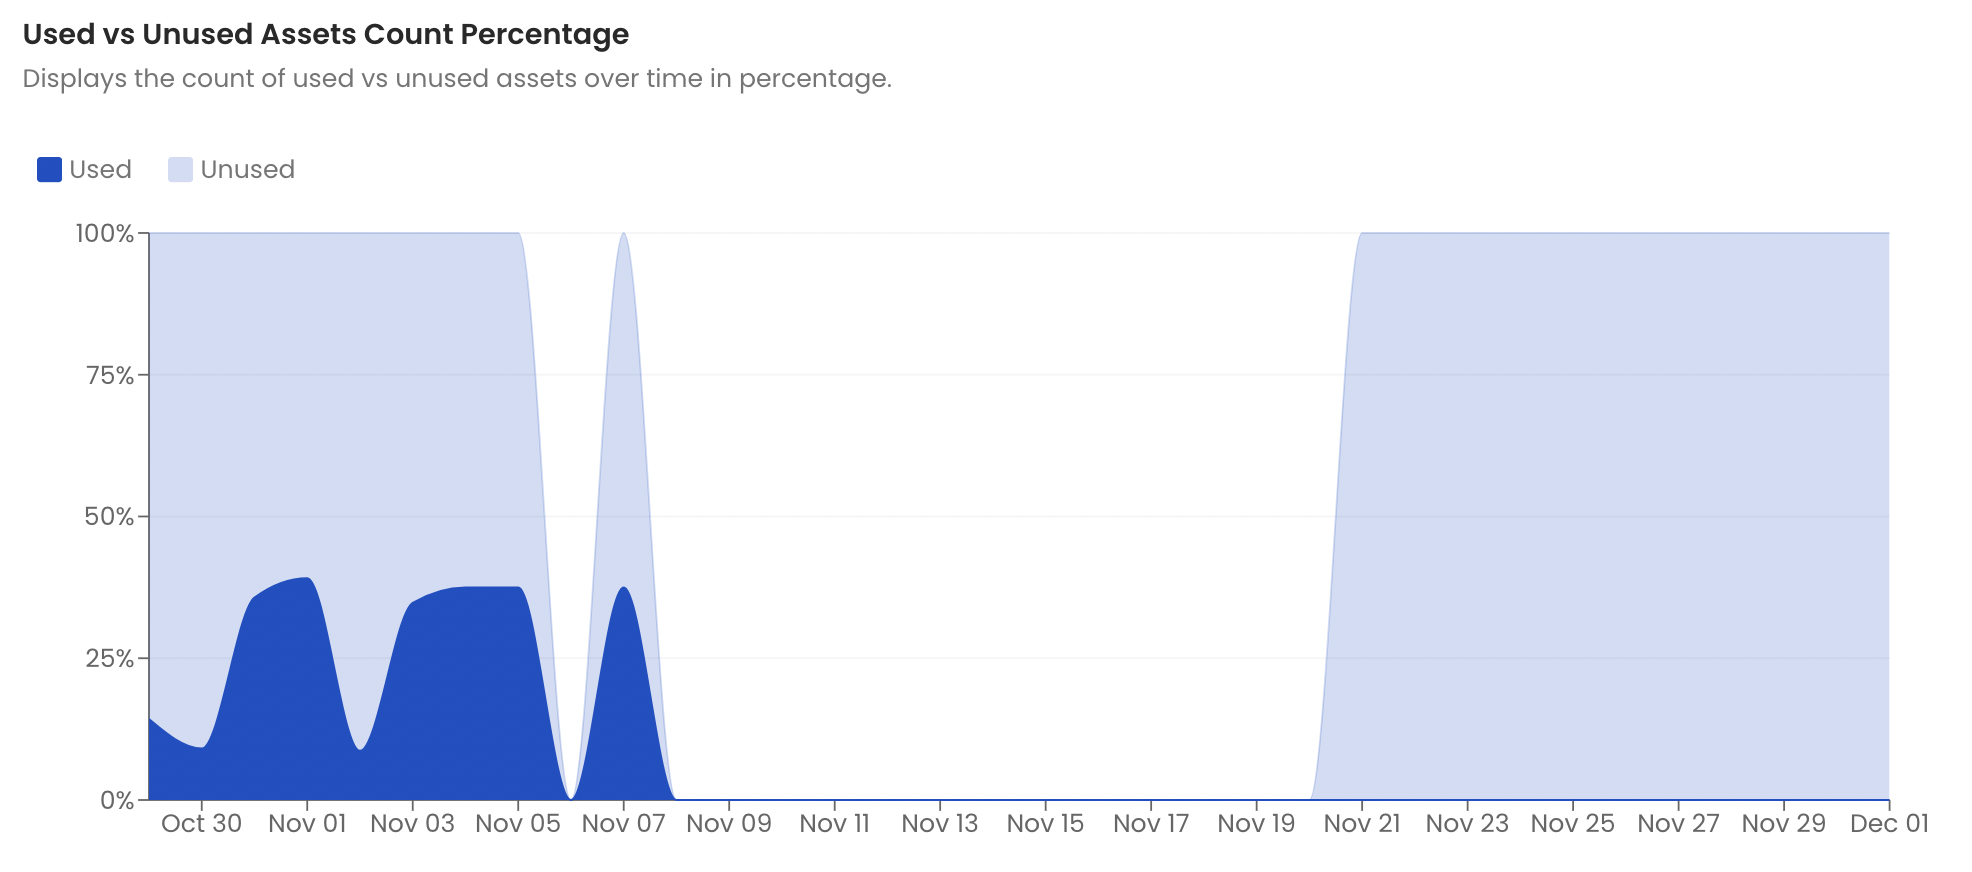
Used vs Unused Assets Count Percentage
Unused Assets
A list of the unused assets is displayed.
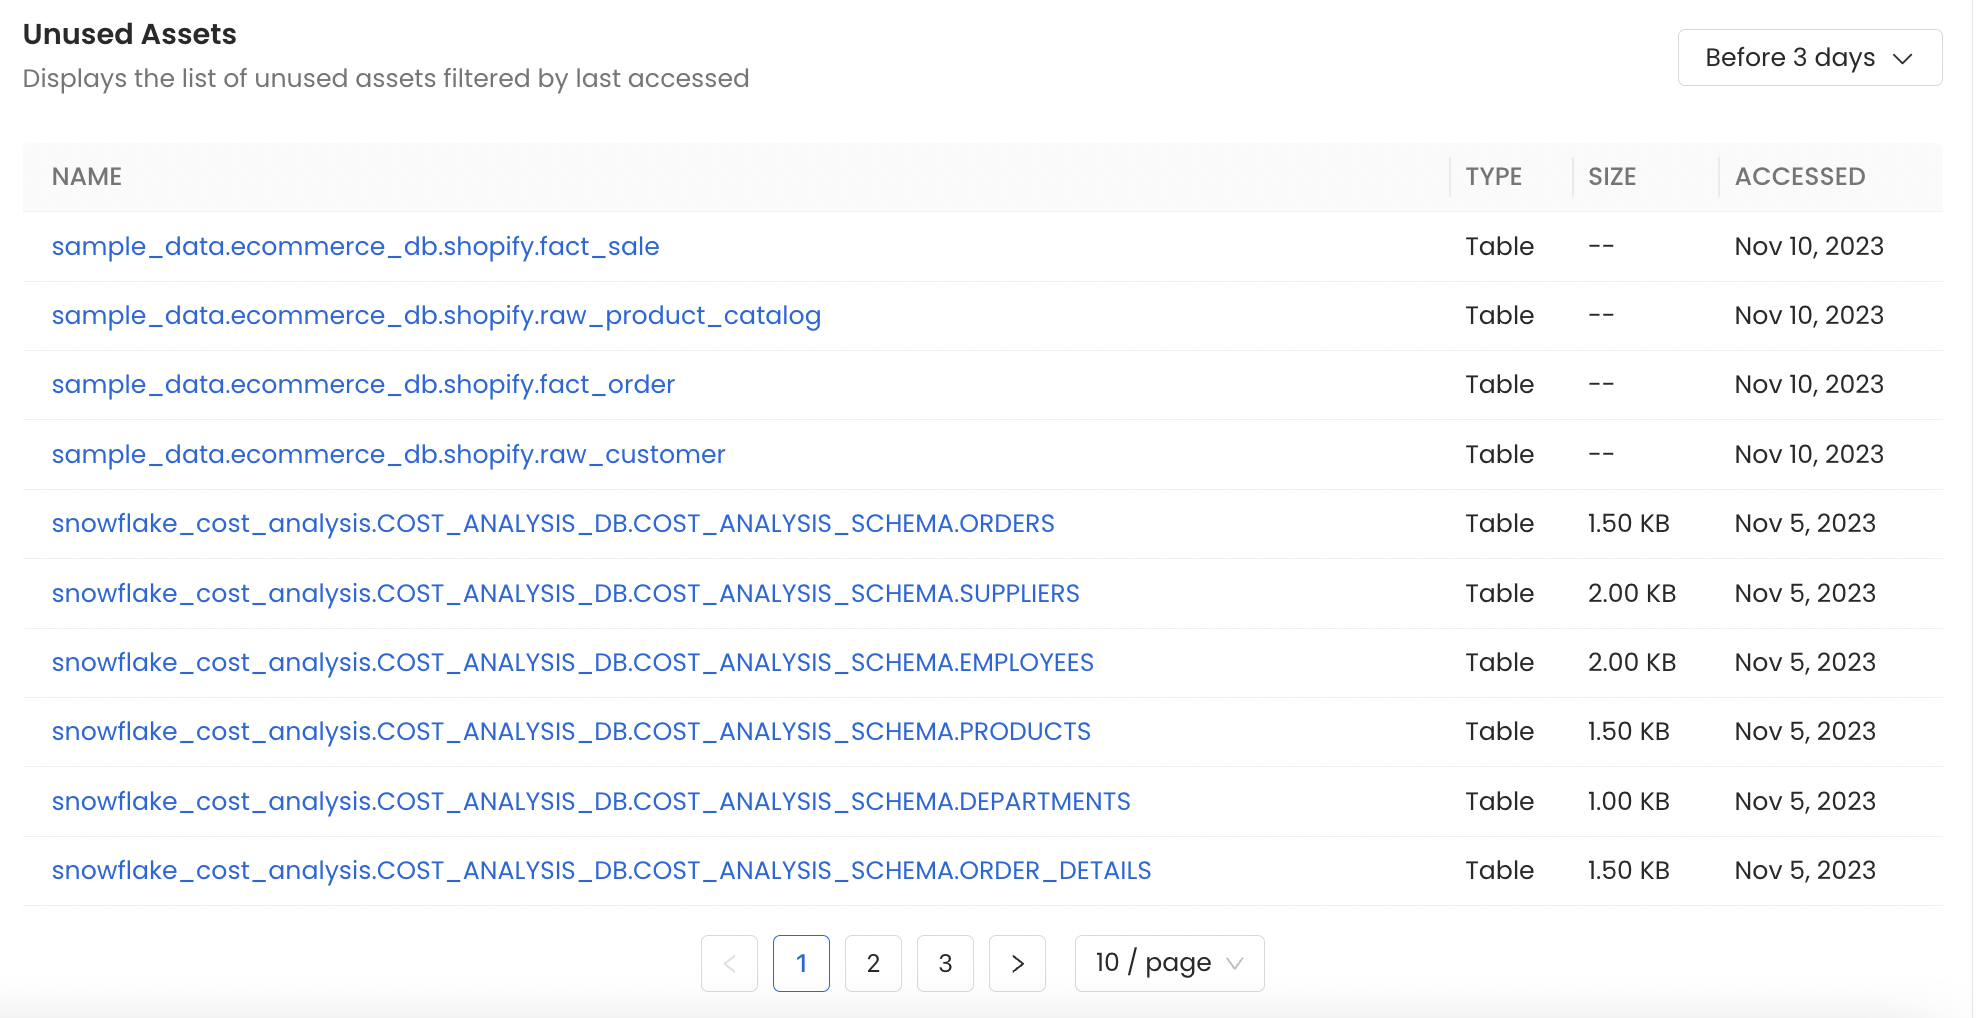
Unused Assets
Frequently Used Assets
A list of the Frequently Used Assets is displayed.
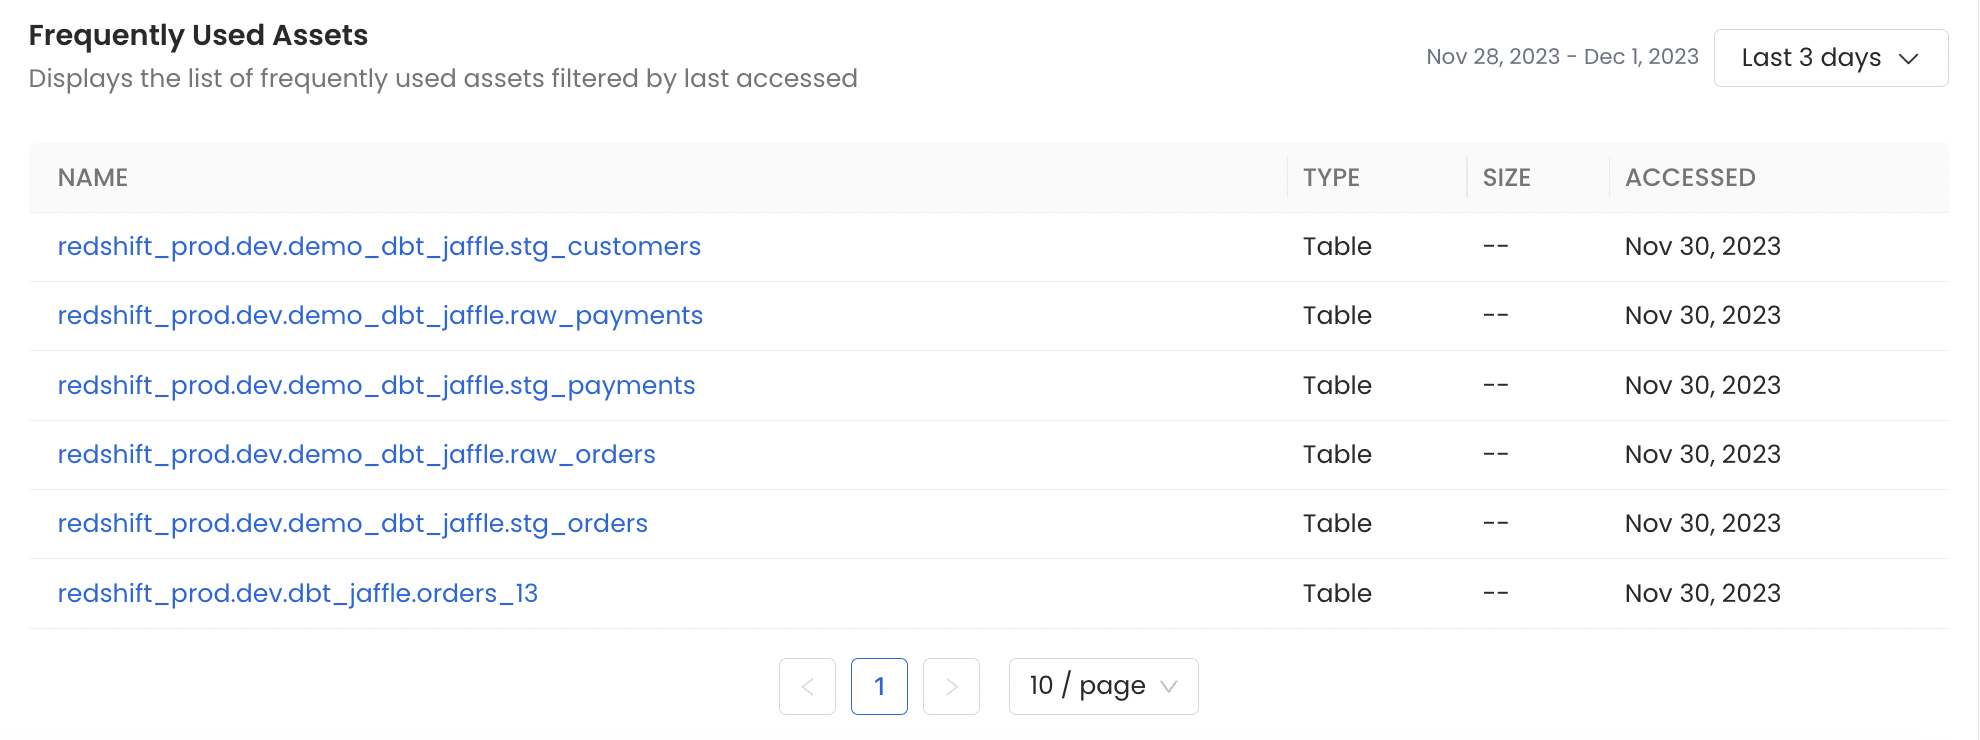
Frequently Used Assets