Profiler and Data Quality Tab
The Profiler & Data Quality tab is displayed only for Tables. It has three sub-tabs for Table Profile, Column Profile, and Data Quality.
Table Profile Tab
The table profile helps to monitor and understand the table structure. It displays the number of rows and columns in the table. You can view these details over a timeframe to understand how the table has been evolving. It displays the profile sample either as an absolute number or as a percentage of data. You also get details on the size of the data as well as when the table was created.

Table Profile
The Table Profile tab also displays timeseries graphs on Data Volume, Table Updates, and Volume Change.
Data Volume
The Data Volume chart gives an overview on how the data is evolving across a time period.

Table Profile: Data Volume
Table Updates
In Table Updates chart, users can view the changes that happened in the table in terms of data inserts, updates, and deletes.

Table Profile: Table Updates
Volume Change
In Volume Change chart, users can view the changes that happened in the table in terms of data volume for inserts, updates, and deletes.
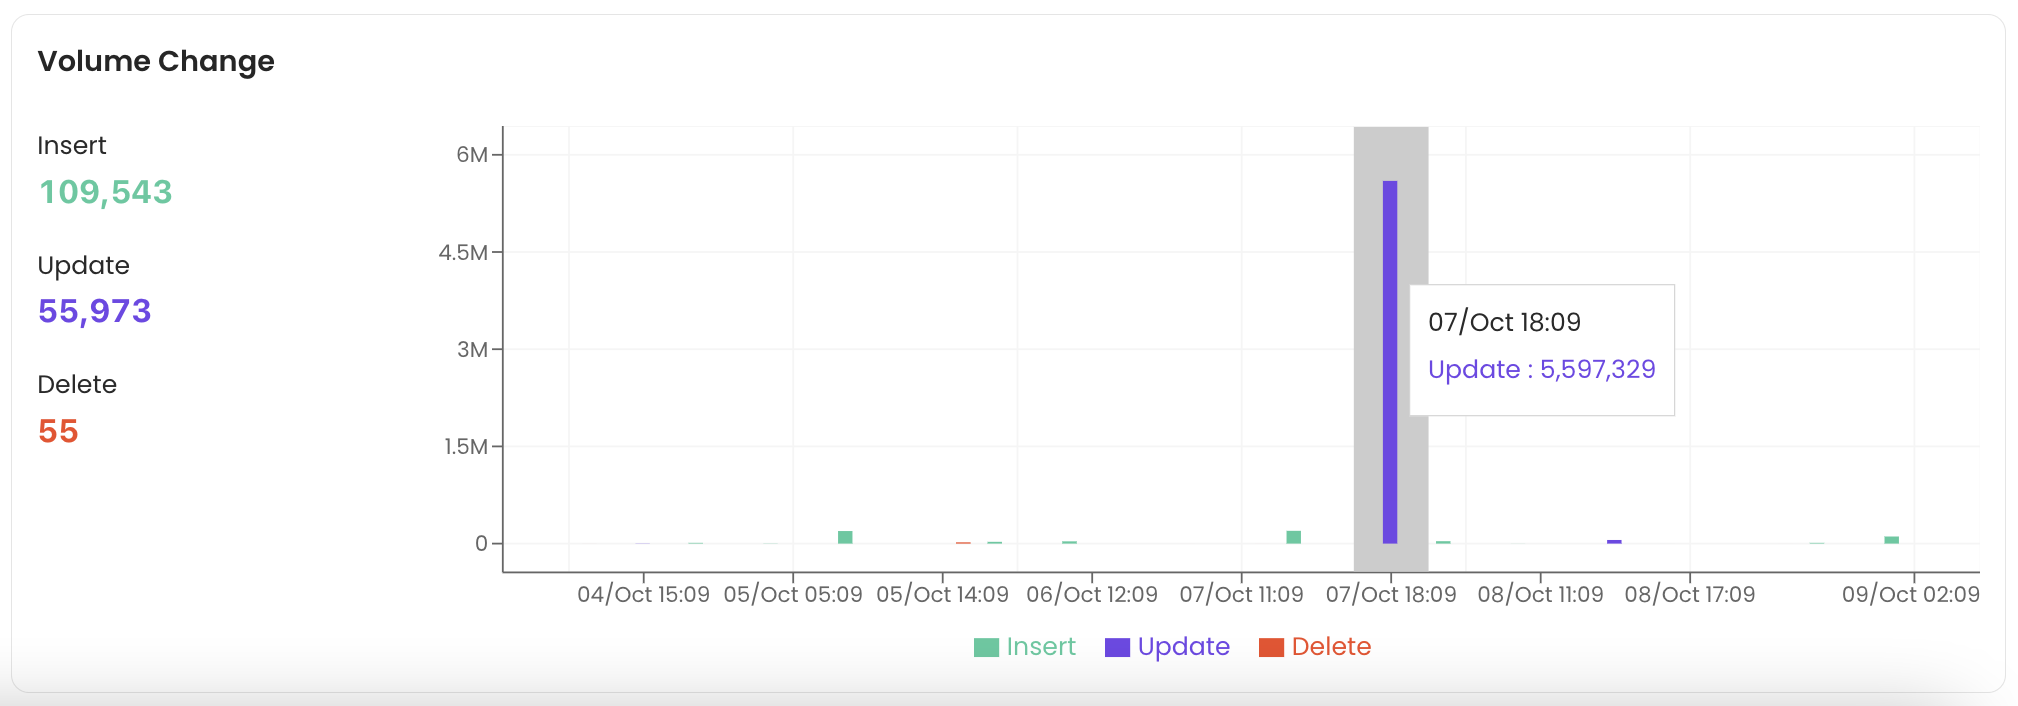
Table Profile: Volume Change
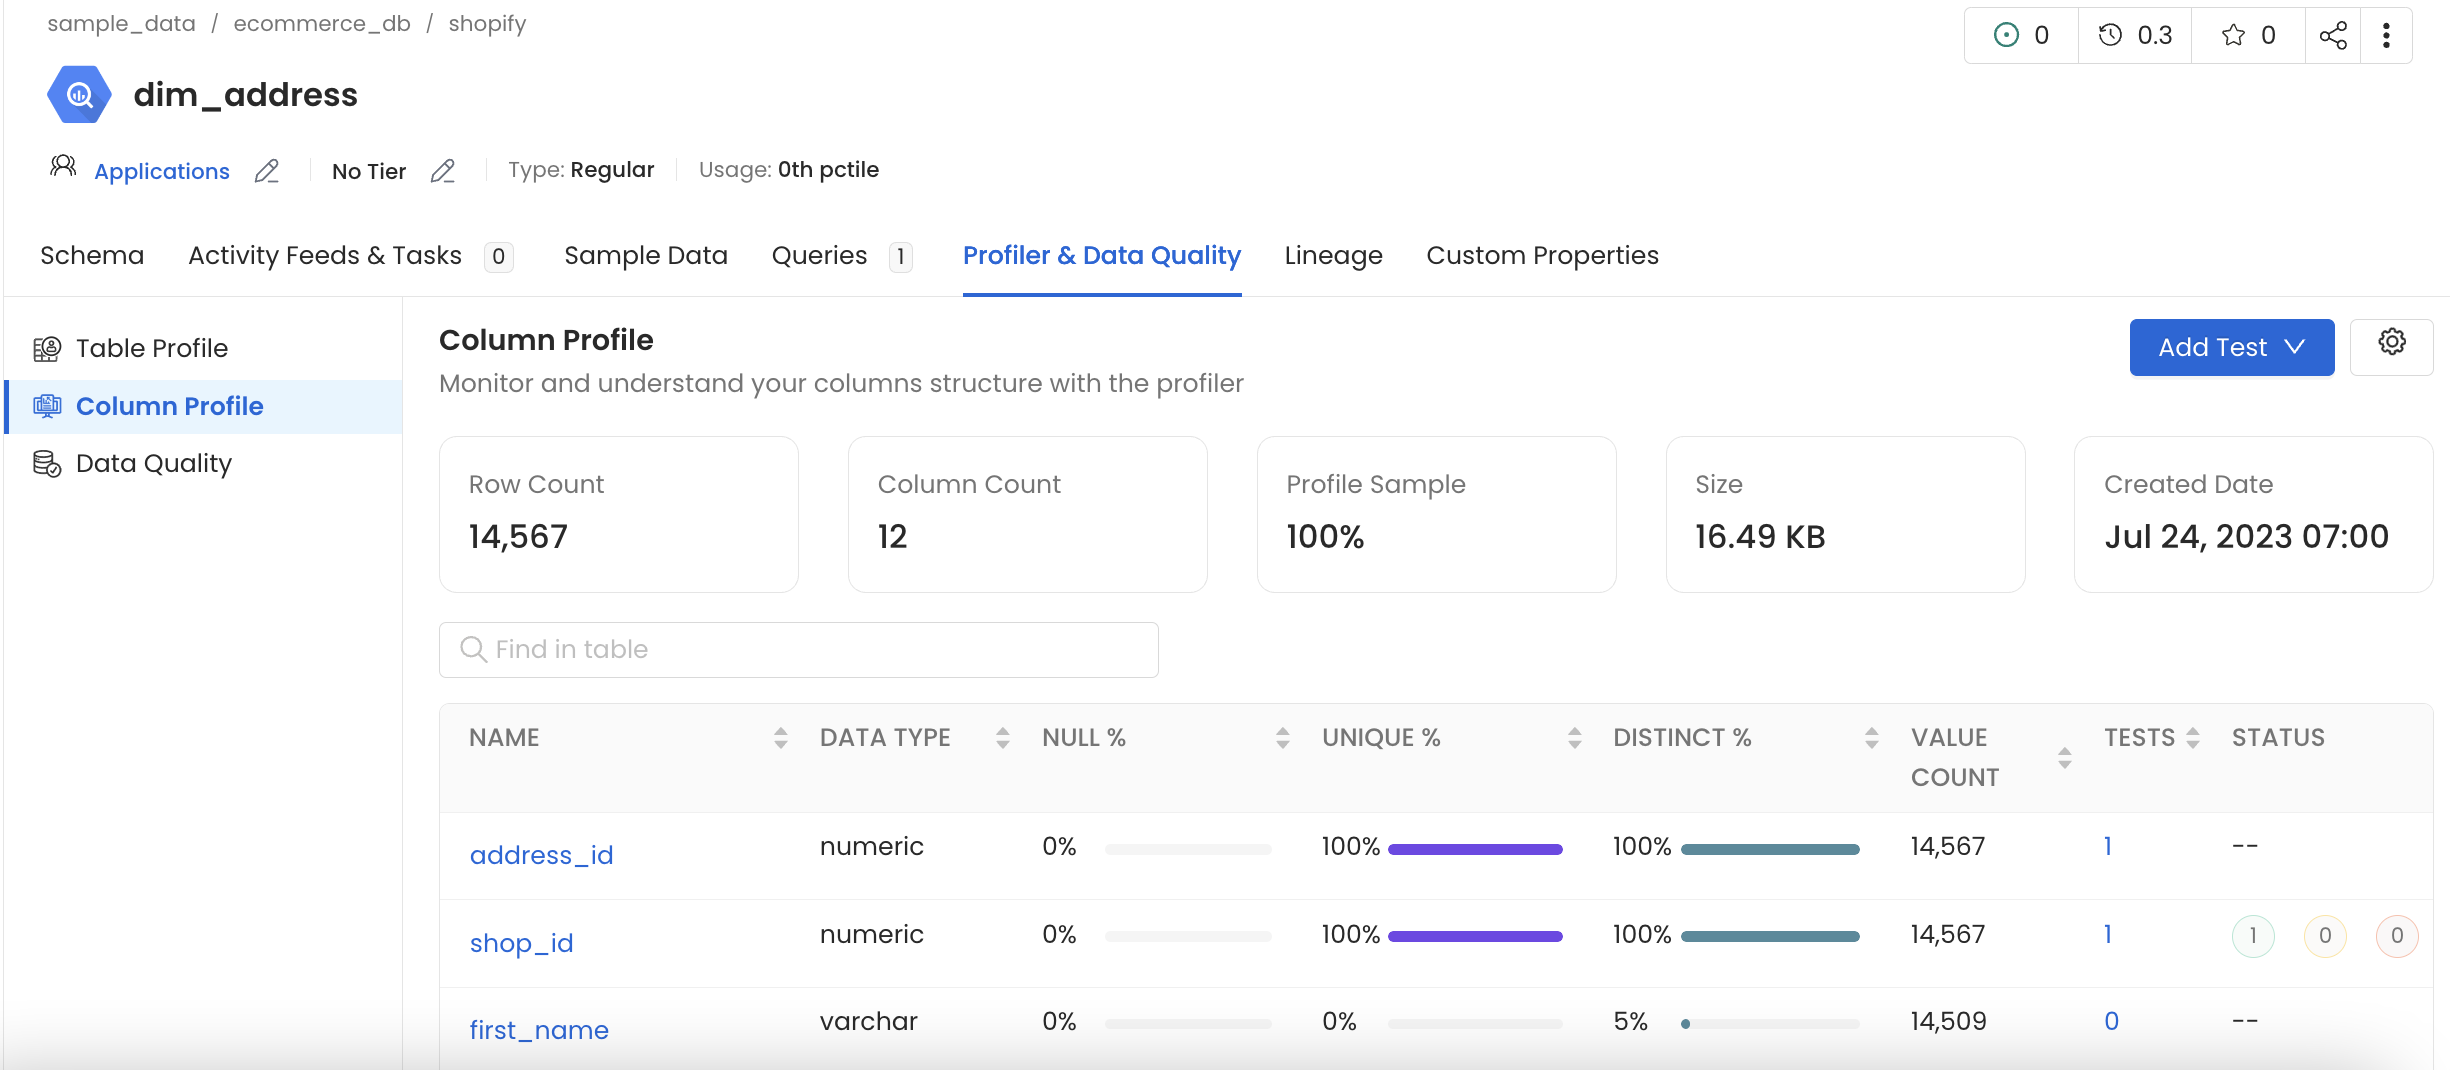
Column Profile Tab
The Column Profile tab provides a summary of table metrics similar to the Table Profile tab. It displays the number of rows and columns over a period of time. It displays the profile sample either as an absolute number or as a percentage of data. You also get details on the size of the data as well as when the table was created.
The column profile helps to monitor and understand the column structure with a summary of metrics for every column. You can view the type of each column, the value count, null value %, distinct value %, unique %, the tests run as well as the test status.
Column Profile of a Table
By clicking on any column, you can view more detailed reports about that column.

Column Profile of a Column
The Column Profile for a particular column also displays timeseries graphs on Data Counts, Data Proportions, Data Range, Data Aggregate, Data Quartiles, and Data Distribution. Based on the type of column you are viewing, you can verify the accuracy of the data values.
Data Counts
The data counts chart provides information on the Distinct Count, Null Count, Unique Count, and Values Count.
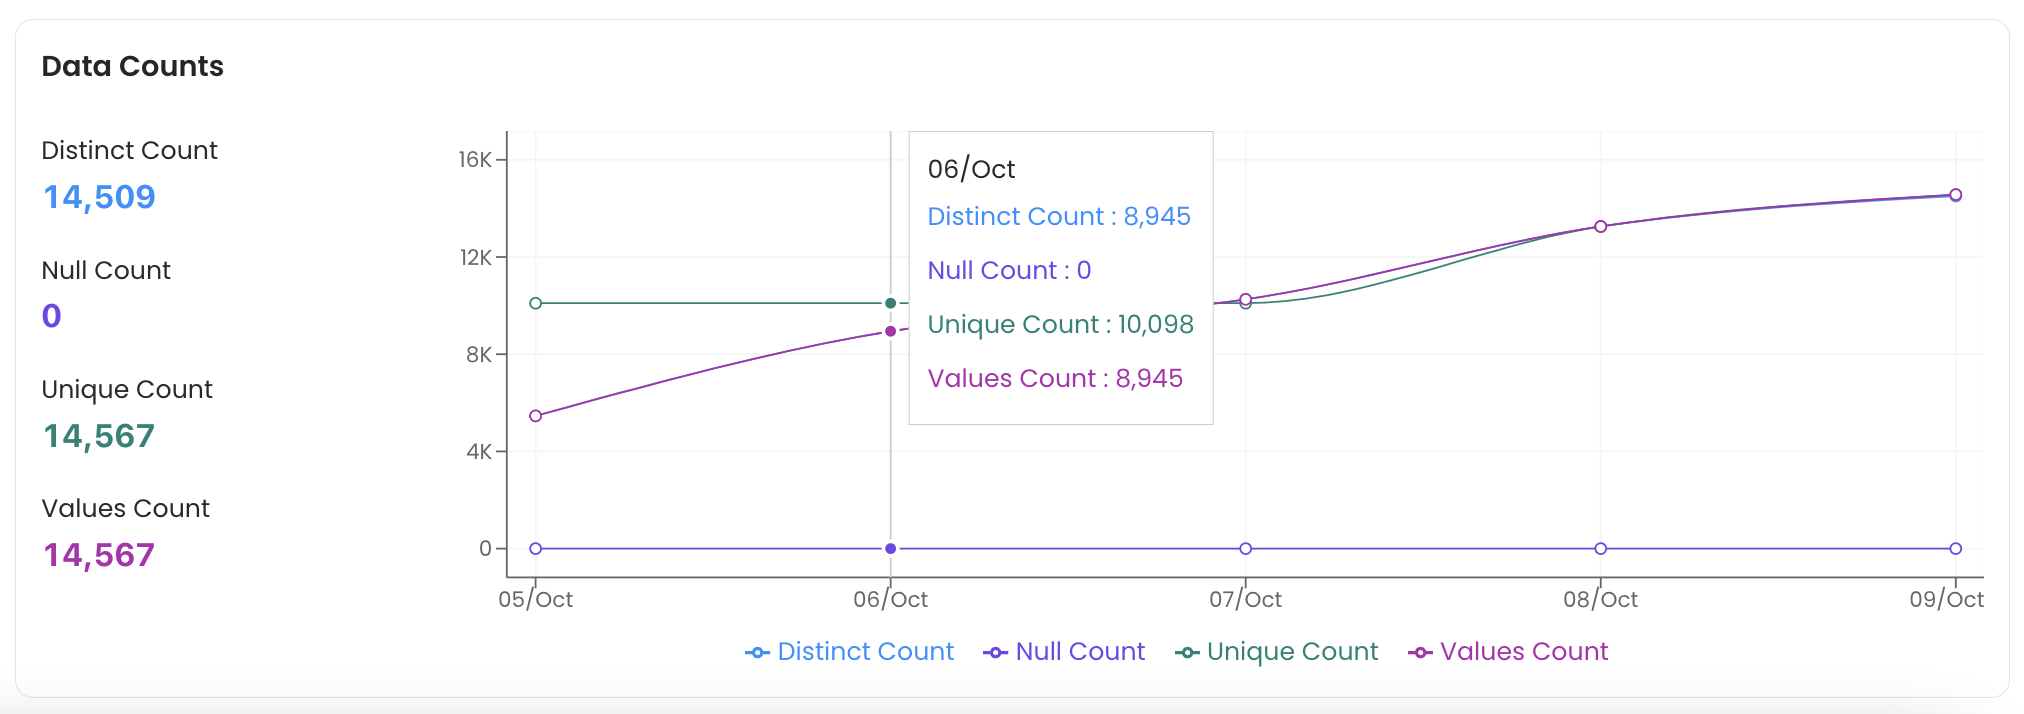
Column Profile: Data Counts
Data Proportions
The data proportions chart displays the Distinct, Null, and Unique Proportions.
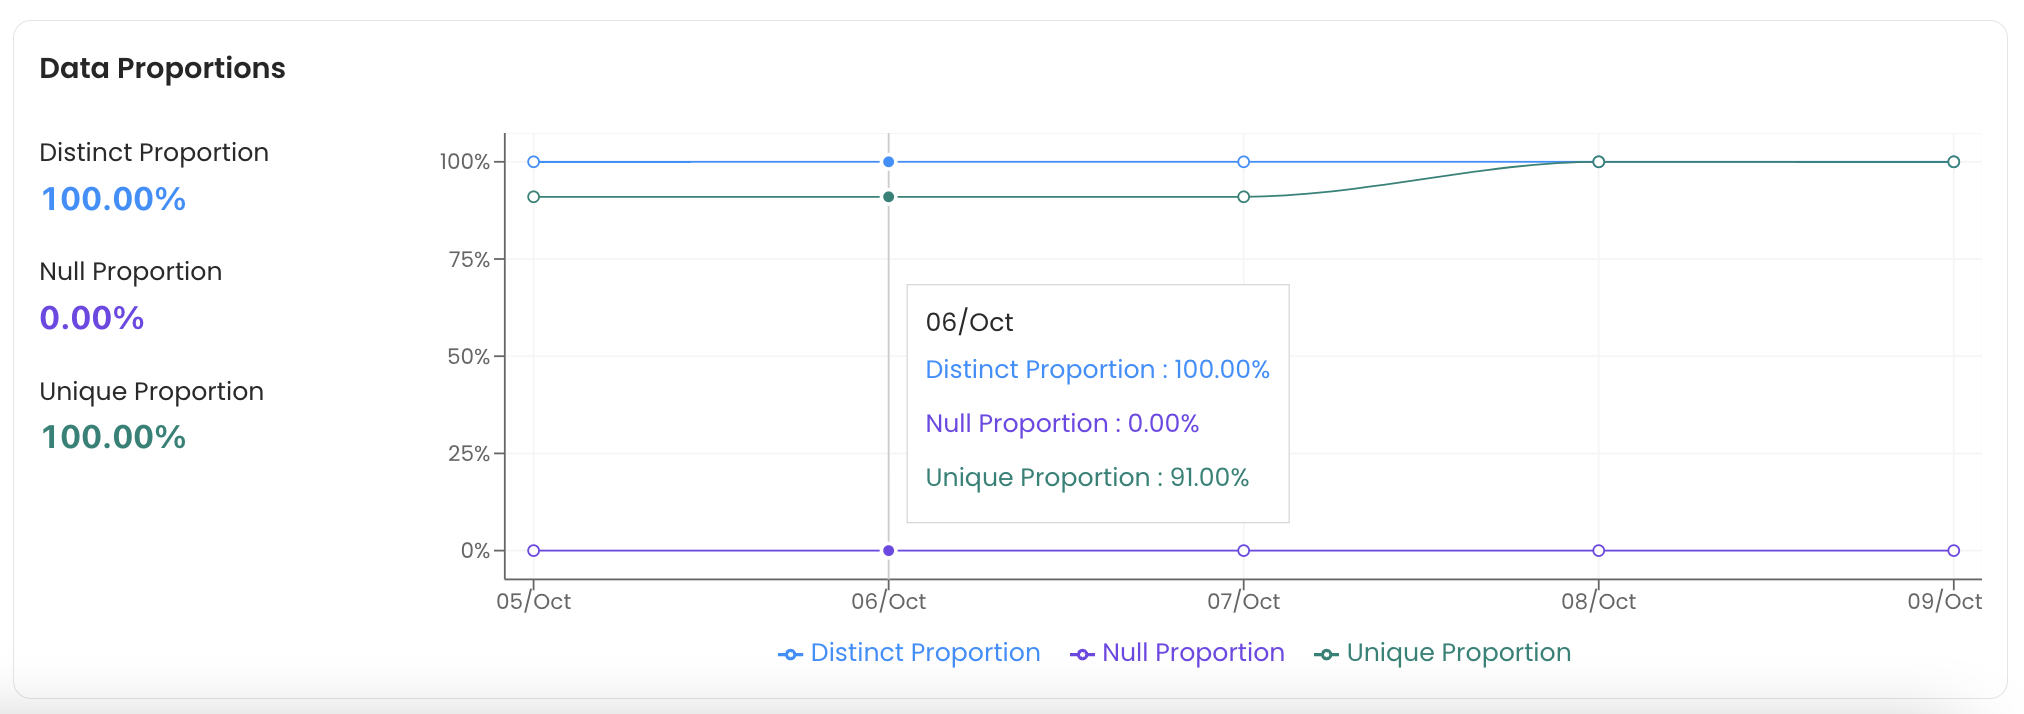
Column Profile: Data Proportions
Data Range
The length of the string that are stored in the database is profiled. The data range displays the Minimum, Maximum, and Mean values, which can be helpful for users who are doing an NLP or Text analysis.
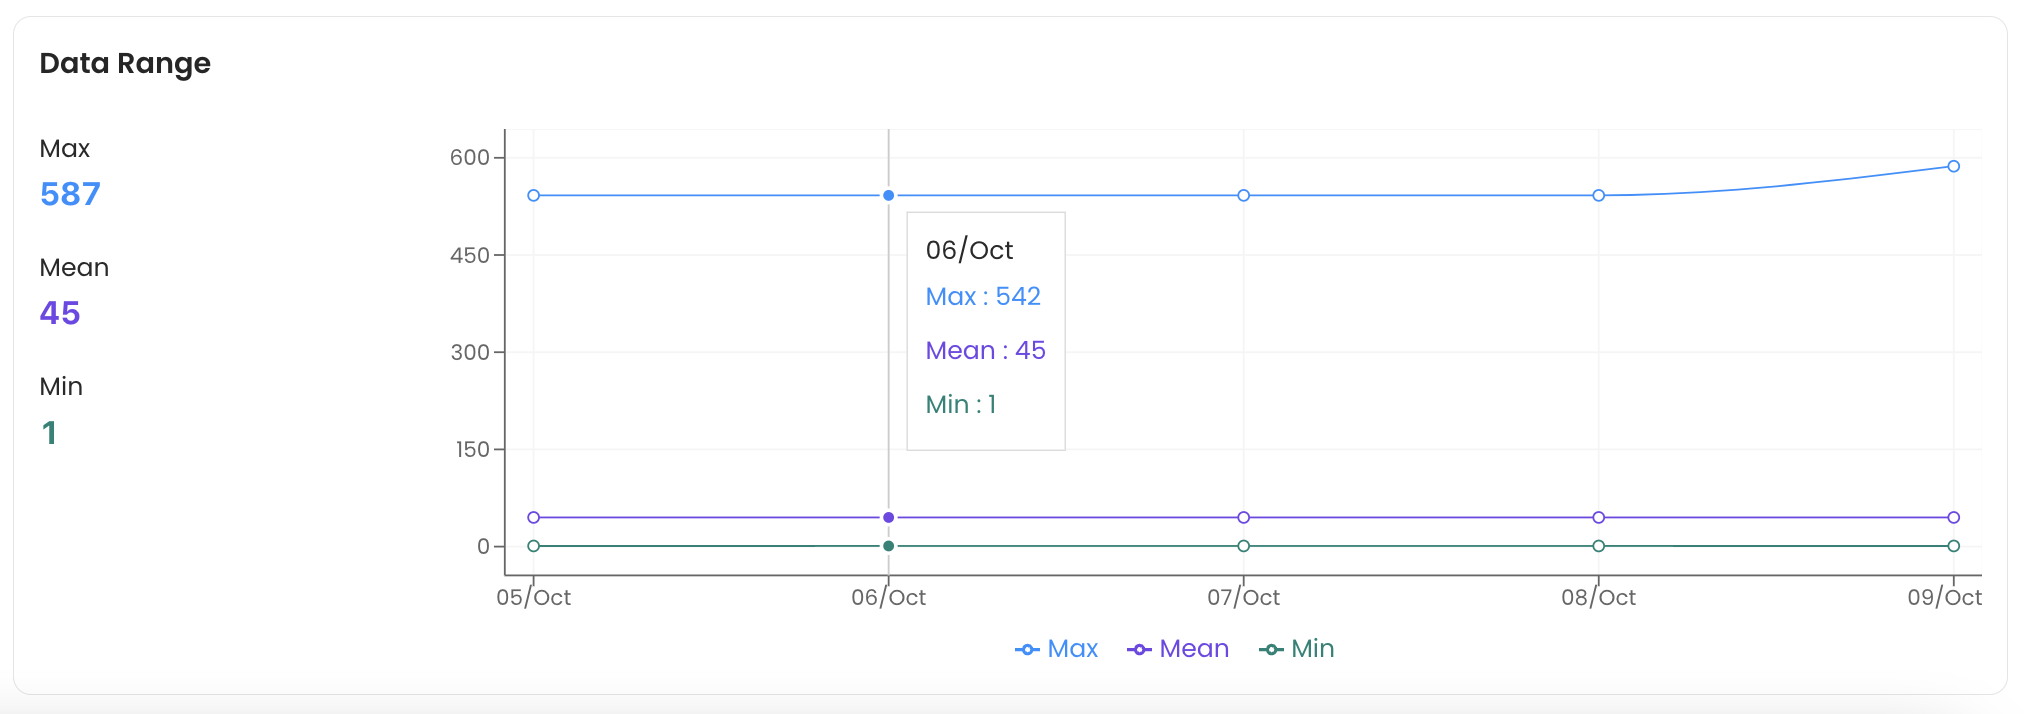
Column Profile: Data Range
Data Aggregate

Column Profile: Data Aggregate
Data Quartiles
This chart displays the First Quartile, Median, Inter Quartile Range, and the Third Quartile.

Column Profile: Data Quartiles
Data Distribution
The distribution of the character length inside the column is displayed to help you get a sense of the structure of your data.

Column Profile: Data Distribution
Data Quality Tab
Data quality tests can be run on the sample data. We can add tests at the table and column level. The Data Quality tab displays the total number of tests that were run, and also the number of tests that were successful, aborted, or failed. The list of test cases displays the details of the table or column on which the test was run.

Profiler & Data Quality
You can click on a Test Case to view further details. You can use a time filter on these reports. You can also edit these tests by clicking on the pencil icon next to each test.

Details of a Test Case
Verify your data quality with table and column level tests.