Profiler Workflow
Learn how to configure and run the Profiler Workflow to extract Profiler data and execute the Data Quality.
For Datalake Profiling, we drop NaN (Not a Number) values from the DataFrame using the dropna() method to allow metric computation. However, we make an exception for null values, which are retained. This ensures that our computations are accurate while handling missing data
UI configuration
After the metadata ingestion has been done correctly, we can configure and deploy the Profiler Workflow.
This Pipeline will be in charge of feeding the Profiler tab of the Table Entity, as well as running any tests configured in the Entity.
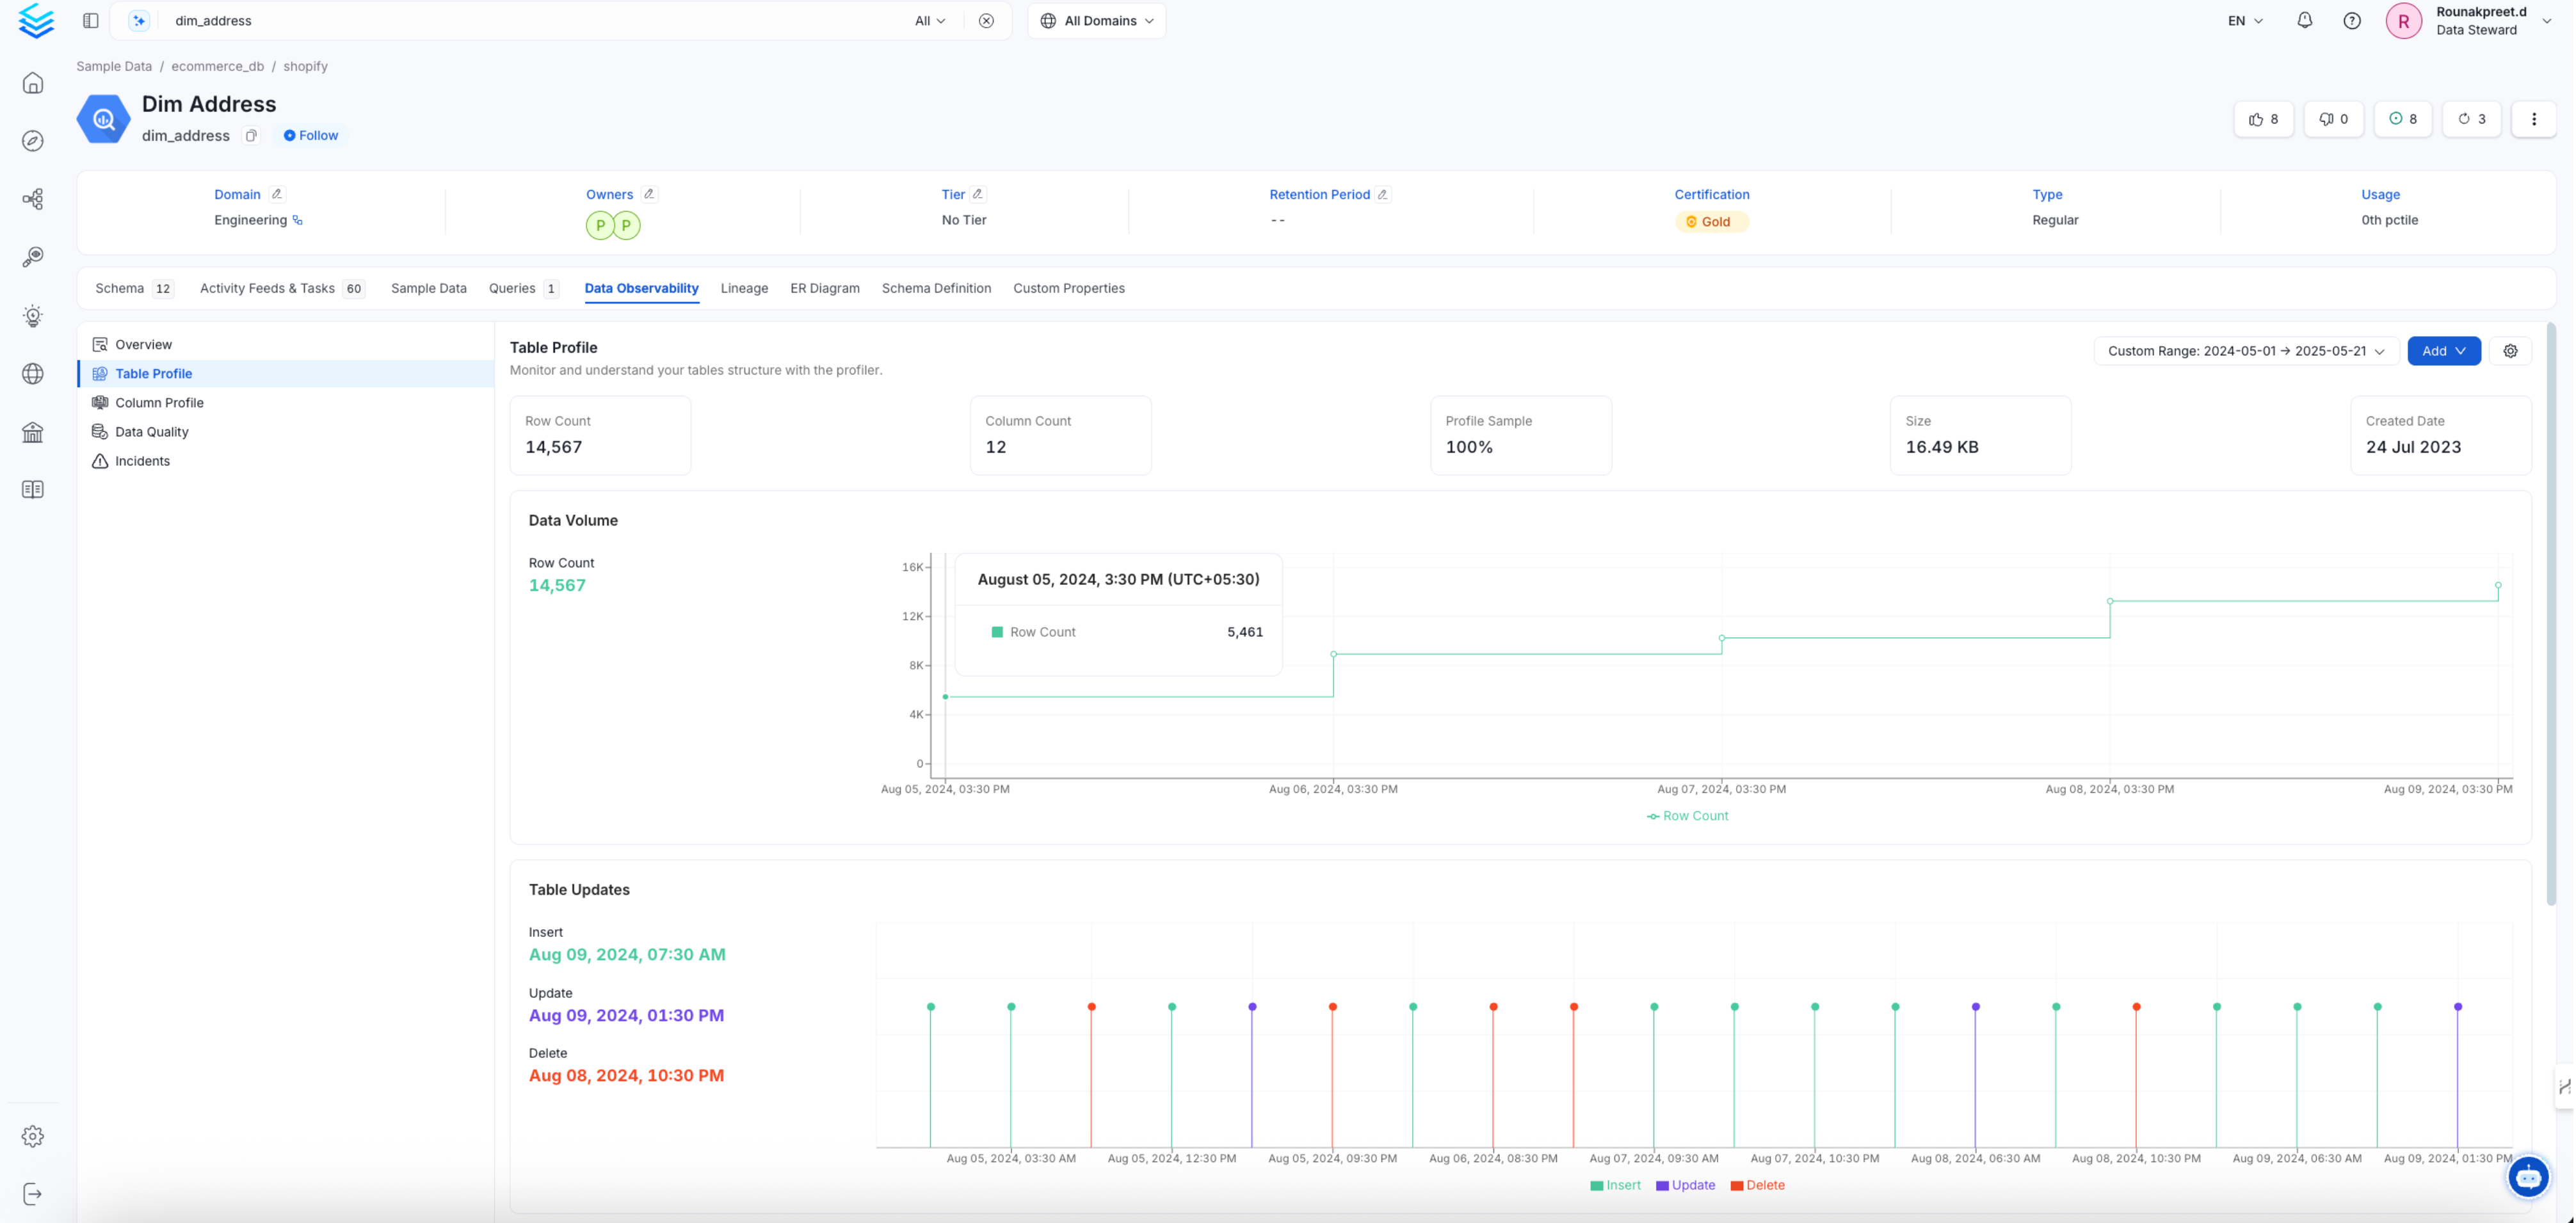
Table profile summary page
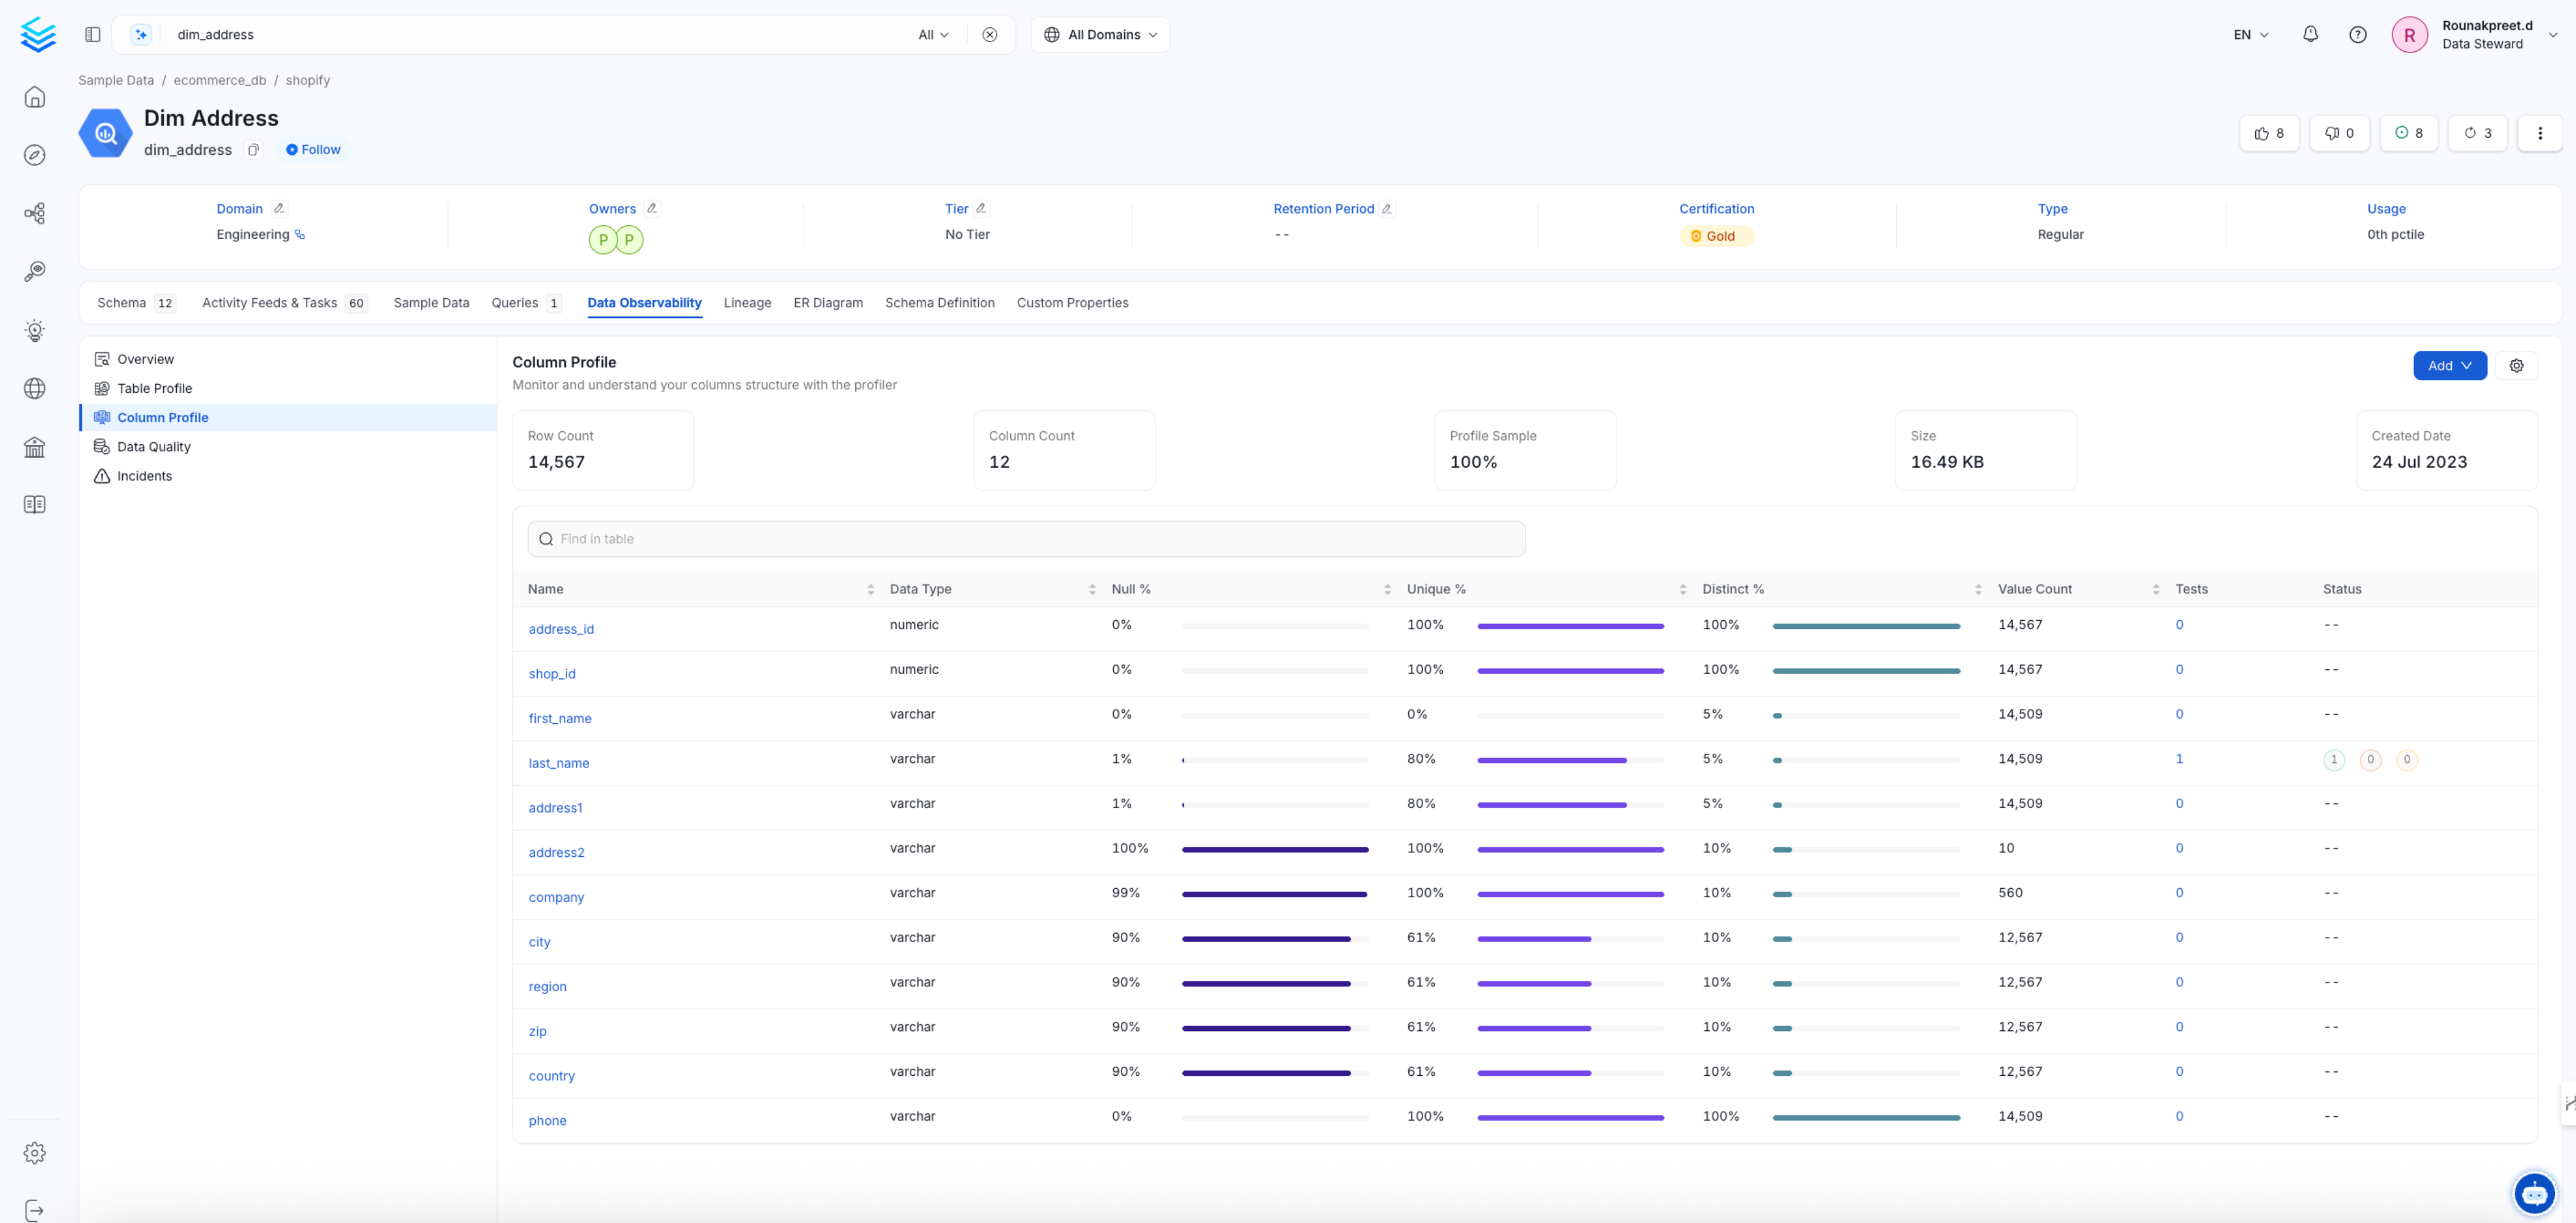
Column profile summary page
1. Add a Profiler Agent
From the Service Page, go to the Agents tab to add a new ingestion and click on Add Profiler Agent.
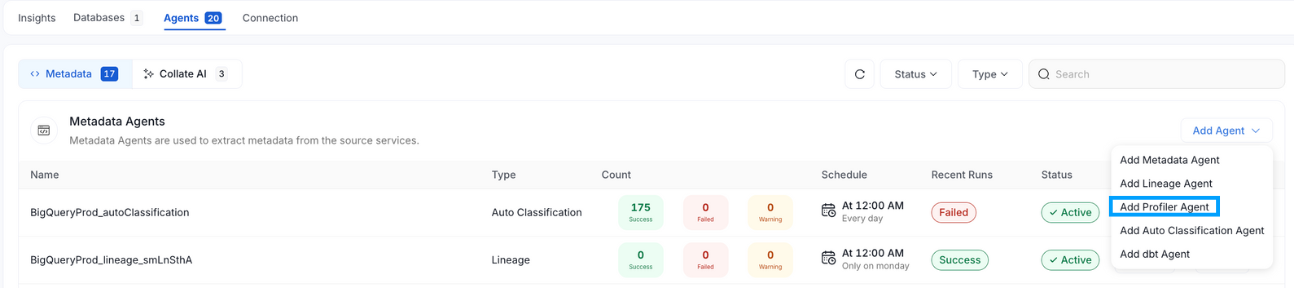
Add a profiler service
2. Configure the Profiler Agent
Here you can enter the Profiler Agent details.
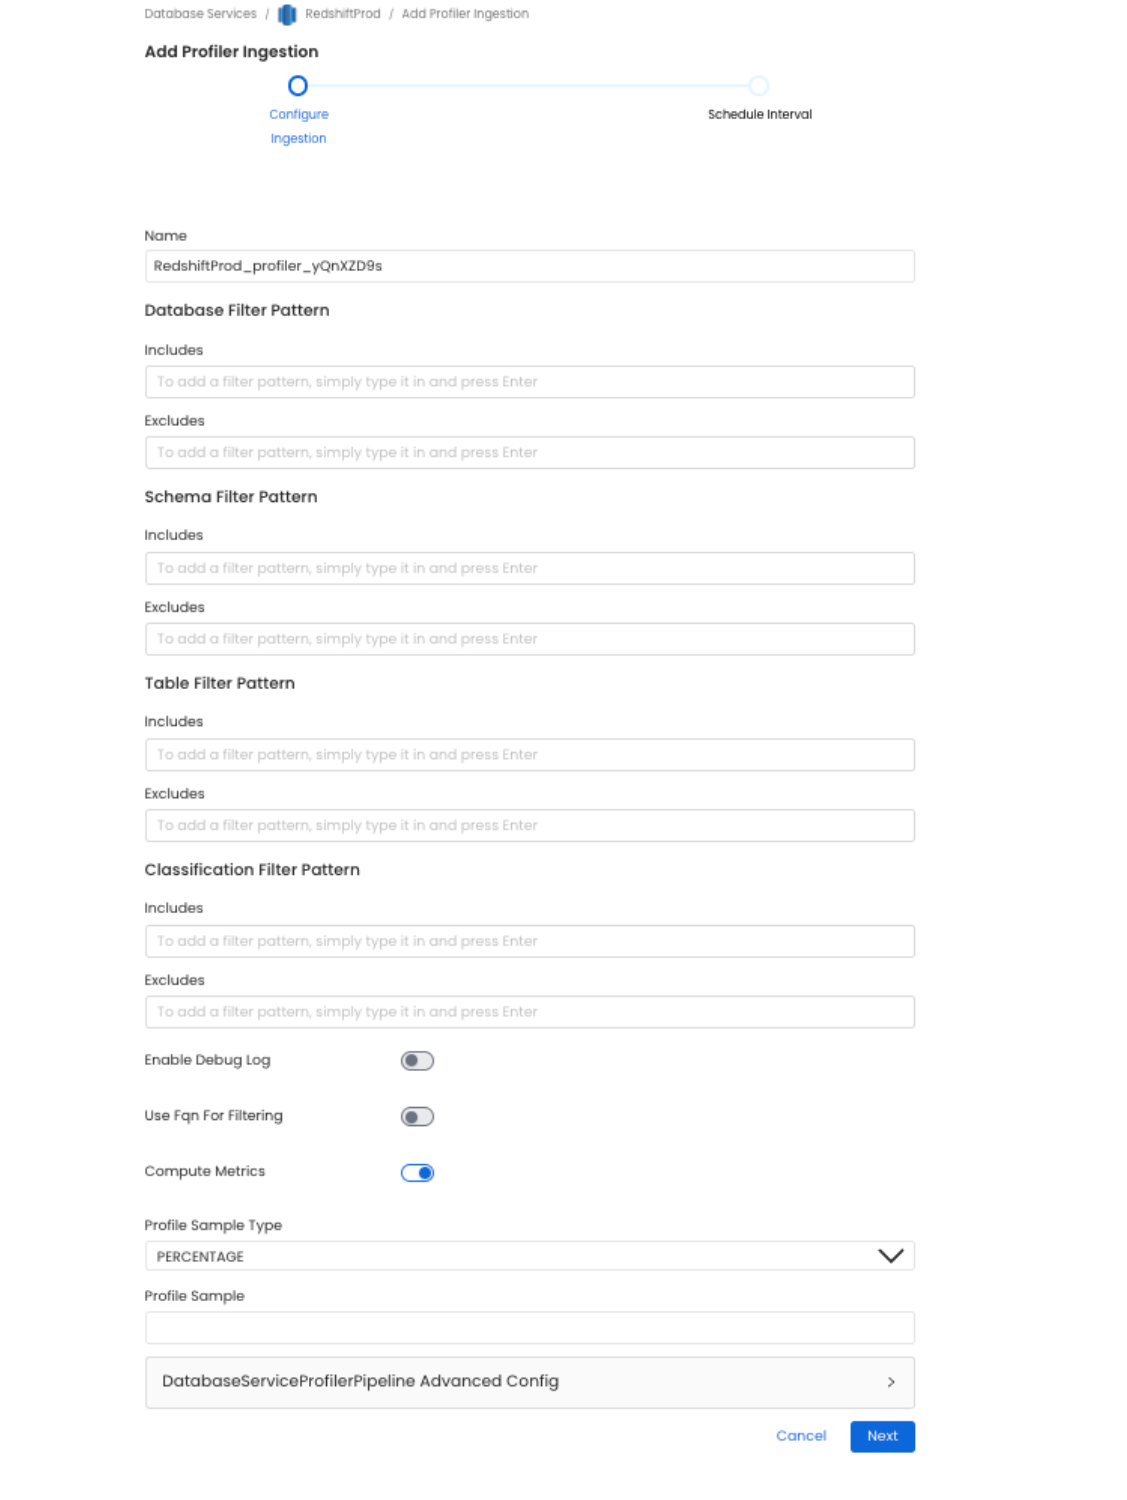
Set profiler configuration
Profiler Options
Name
Define the name of the Profiler Workflow. While we only support a single workflow for the Metadata and Usage ingestion, users can define different schedules and filters for Profiler workflows.
As profiling is a costly task, this enables a fine-grained approach to profiling and running tests by specifying different filters for each pipeline.
Database filter pattern (Optional)
regex expression to filter databases.
Schema filter pattern (Optional)
regex expression to filter schemas.
Table filter pattern (Optional)
regex expression to filter tables.
Profile Sample (Optional)
Set the sample to be use by the profiler for the specific table.
Percentage: Value must be between 0 and 100 exclusive (0 < percentage < 100). This will sample the table based on a percentageRow Count: The table will be sampled based on a number of rows (i.e.1,000,2,000), etc.
⚠️ This option is currently not support for Druid. Sampling leverage RANDOM functions in most database (some have specific sampling functions) and Druid provides neither of these option. We recommend using the partitioning or sample query option if you need to limit the amount of data scanned.
Enable Debug Log
Set the Enable Debug Log toggle to set the logging level of the process to debug. You can check these logs in the Ingestion tab of the service and dig deeper into any errors you might find.
Include Views
If activated the profiler will compute metric for view entity types. Note that it can have a negative impact on the profiler performance.
Use FQN For Filtering Views
Set this flag when you want to apply the filters on Fully Qualified Names (e.g service_name.db_name.schema_name.table_name) instead of applying them to the raw name of the asset (e.g table_name). This Flag is useful in scenarios when you have different schemas with same name in multiple databases, or tables with same name in different schemas, and you want to filter out only one of them.
Compute Metrics
Set the Compute Metrics toggle off to not perform any metric computation during the profiler ingestion workflow. Used in combination with Ingest Sample Data toggle on allows you to only ingest sample data.
Advanced Configuration
Sample Data Rows Count
Set the number of rows to ingest when Ingest Sample Data toggle is on. Defaults to 50.
Thread Count (Optional)
Number of thread to use when computing metrics for the profiler. For Snowflake users we recommend setting it to 1. There is a known issue with one of the dependency (snowflake-connector-python) affecting projects with certain environments.
Timeout in Seconds (Optional)
This will set the duration a profiling job against a table should wait before interrupting its execution and moving on to profiling the next table. It is important to note that the profiler will wait for the hanging query to terminate before killing the execution. If there is a risk for your profiling job to hang, it is important to also set a query/connection timeout on your database engine. The default value for the profiler timeout is 12-hours.
3. Schedule and Deploy
After clicking Next, you will be redirected to the Scheduling form. This will be the same as the Metadata and Usage Ingestions. Select your desired schedule and click on Deploy to find the usage pipeline being added to the Service Ingestions.
4. Updating Profiler setting at the table level
Once you have created your profiler you can adjust some behavior at the table level by going to the table and clicking on the profiler tab
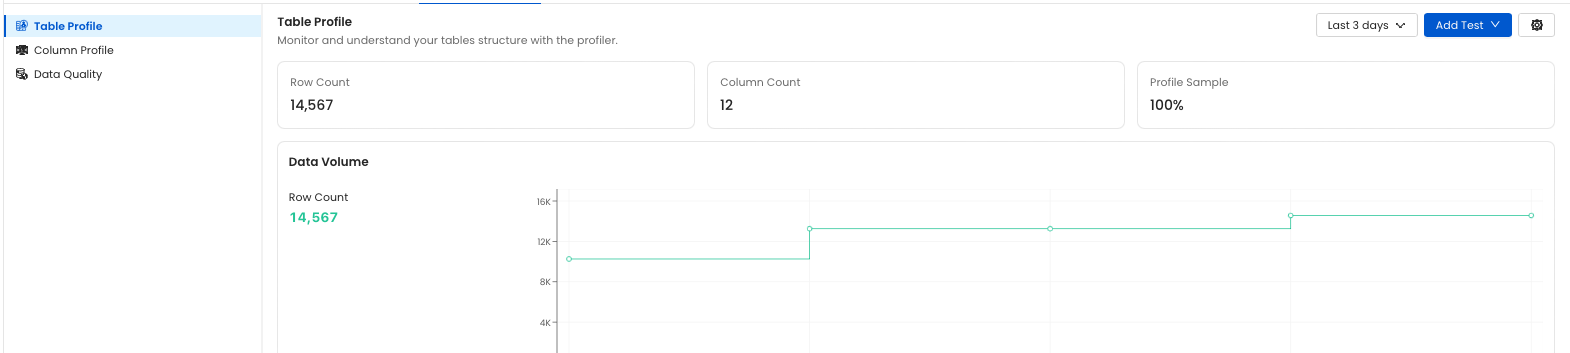
table profile settings
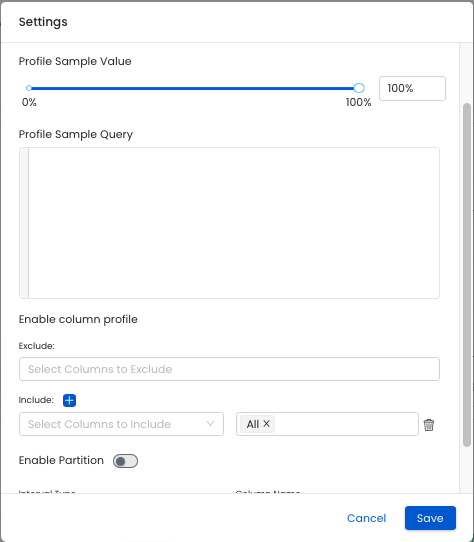
table profile settings
Profiler Options
Profile Sample Set the sample to be use by the profiler for the specific table.
Percentage: Value must be between 0 and 100 exclusive (0 < percentage < 100). This will sample the table based on a percentageRow Count: The table will be sampled based on a number of rows (i.e.1,000,2,000), etc.
⚠️ This option is currently not support for Druid. Sampling leverage RANDOM functions in most database (some have specific sampling functions) and Druid provides neither of these option. We recommend using the partitioning or sample query option if you need to limit the amount of data scanned.
Enable Column Profile This setting allows user to exclude or include specific columns and metrics from the profiler.
Note: for Google BigQuery tables partitioned on timestamp/datetime column type, month and year interval are not supported. You will need to set the Interval Unit to DAY or HOUR.
Enable Partition When enabled, the profiler will fetch the data based on your profiler settings. Note that if "profile sample" is set, this configuration will be used against the partitioned data and not the whole table.
Column Name: this is the name of the column that will be used as the partition fieldInterval Type:TIME-UNIT: a business logic timestamp/date/datetime (e.g. order date, sign up datetime, etc.)INGESTION-TIME: a process logic timestamp/date/datetime (i.e. when was my data ingested in my table)COLUMN-VALUE: a value representing a chunk of data (e.g. Product Type A, B, C, etc.)INTEGER-RANGE: a range of integer that will be used as the partition (e.g. Customer ID between 1 and 10)
Once you have picked the Interval Type you will need to define the configuration specific to your Interval Type.
INGESTION-TIME or INTEGER-RANGE
Interval: the interval value (e.g.1,2, etc.)Interval Unit:HOURDAYMONTHYEAR
COLUMN-VALUE
Value: a list of value to use for the partitioning logic
INTEGER-RANGE
Start Range: the start of the range (inclusive)End Range: the end of the range (inclusive)
5. Updating Profiler setting at the platform level
The behavior of the profiler can be configured at the platform level. Navigating to Settings > Preferences > Profiler Configuration you will find settings to adjust the behavior of the profiler.
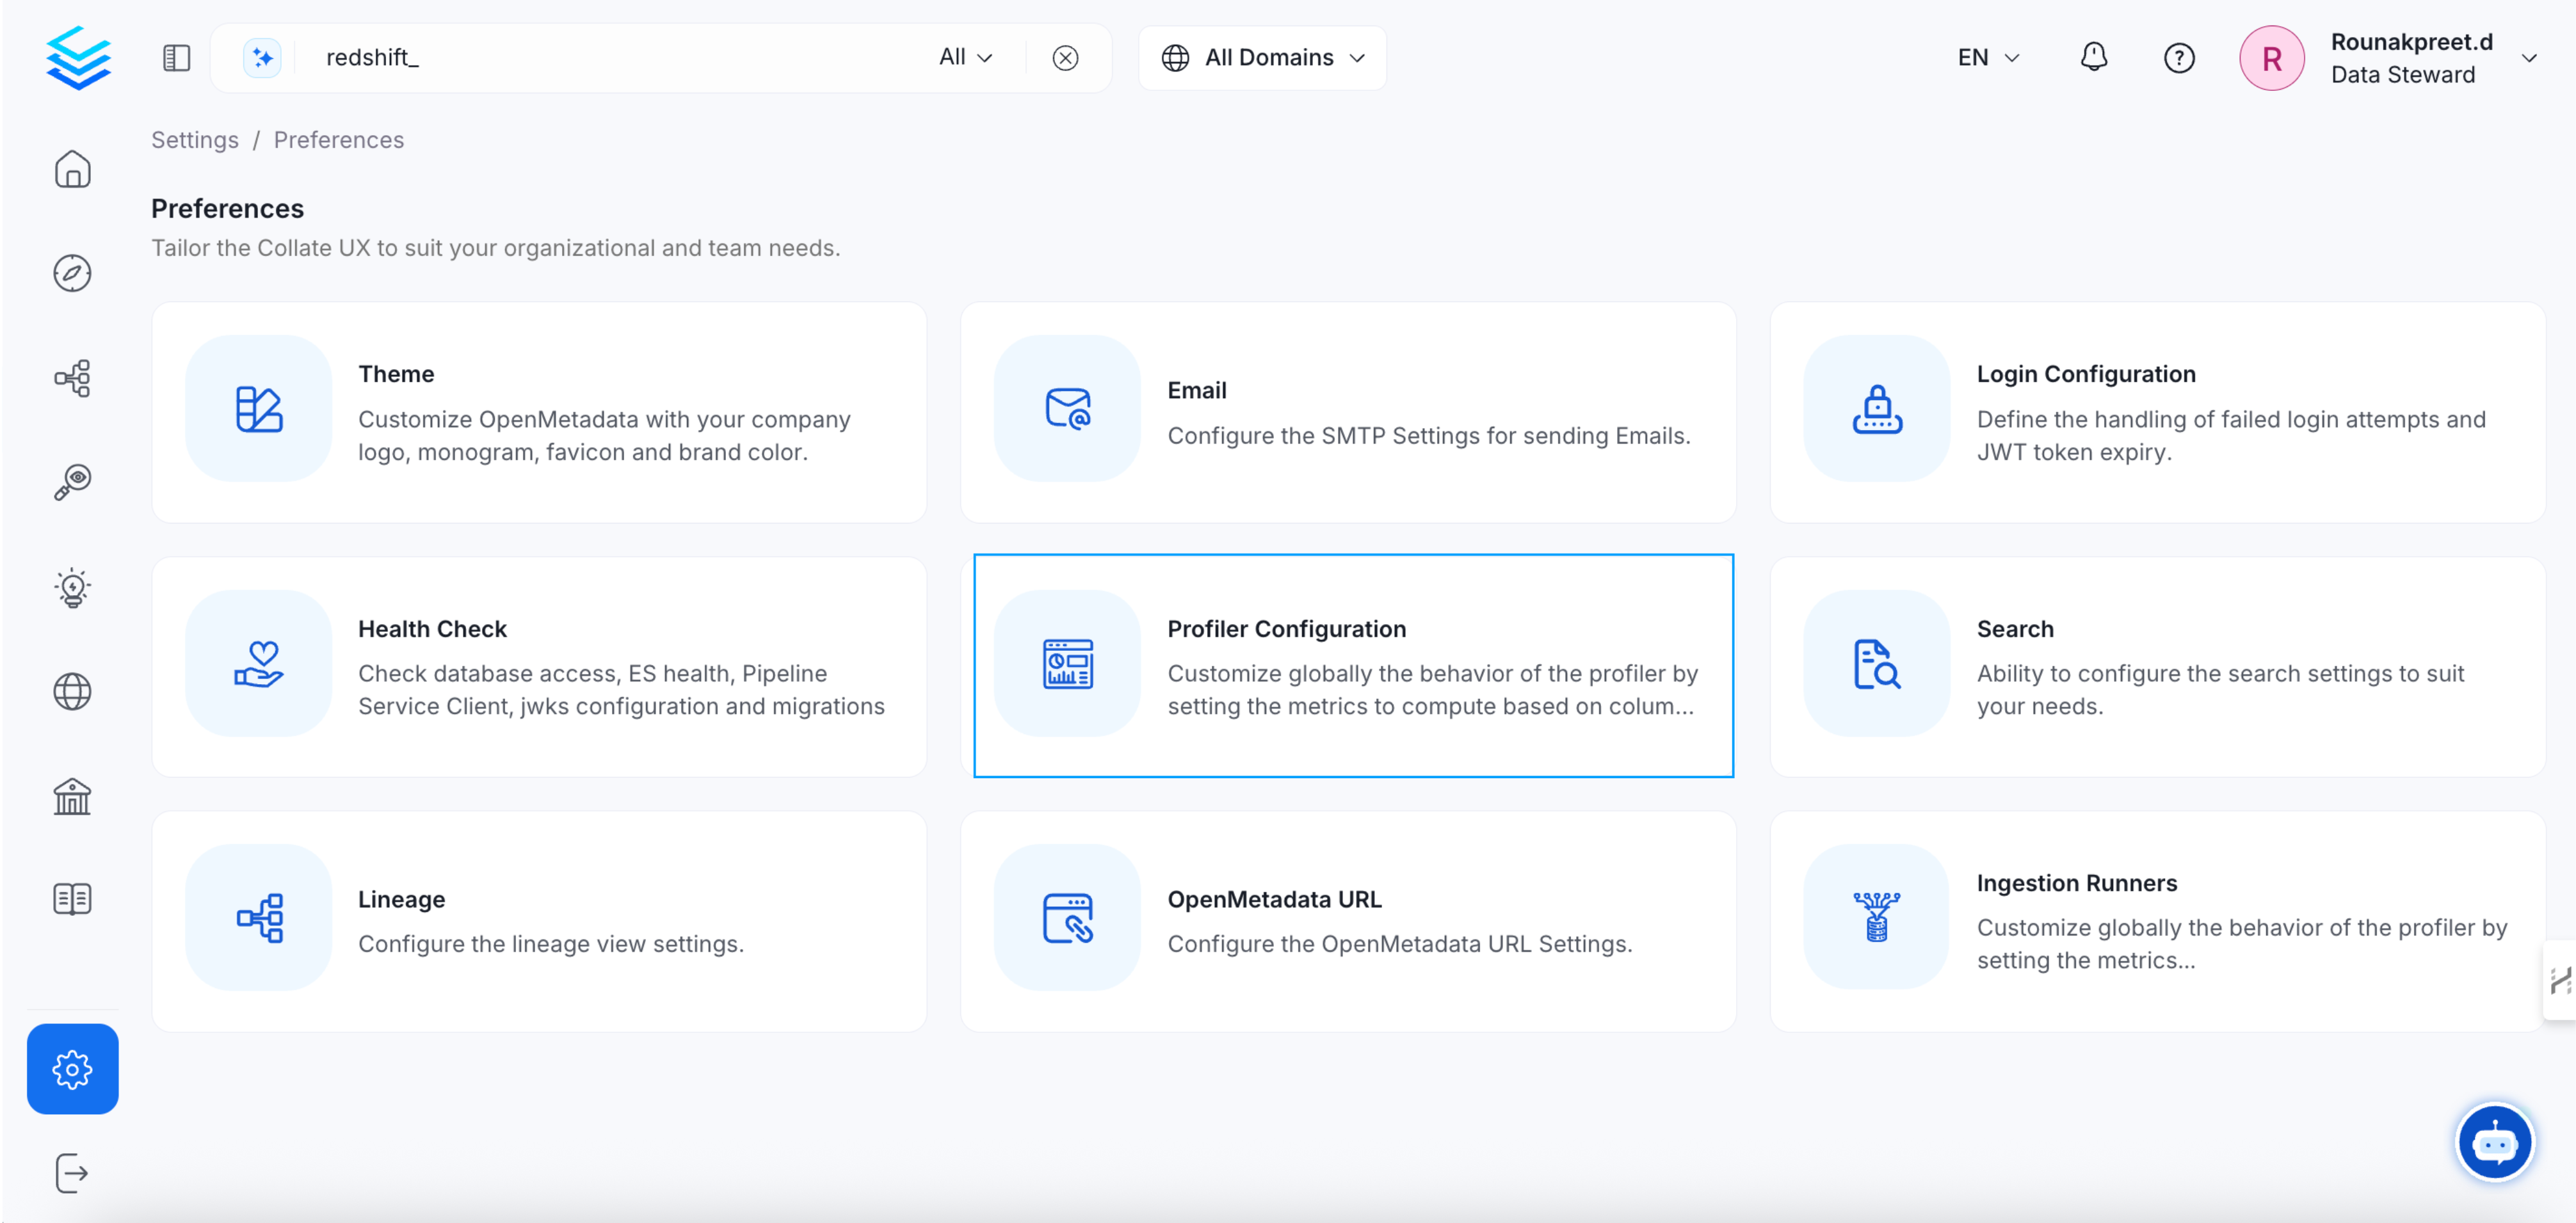
table profile global settings
Disabling All Metric Computation for a Data Type Select the data type you want to disable all metric for. Then toggle disable on. When running the profiler all metric computation will be skipped for the data type.
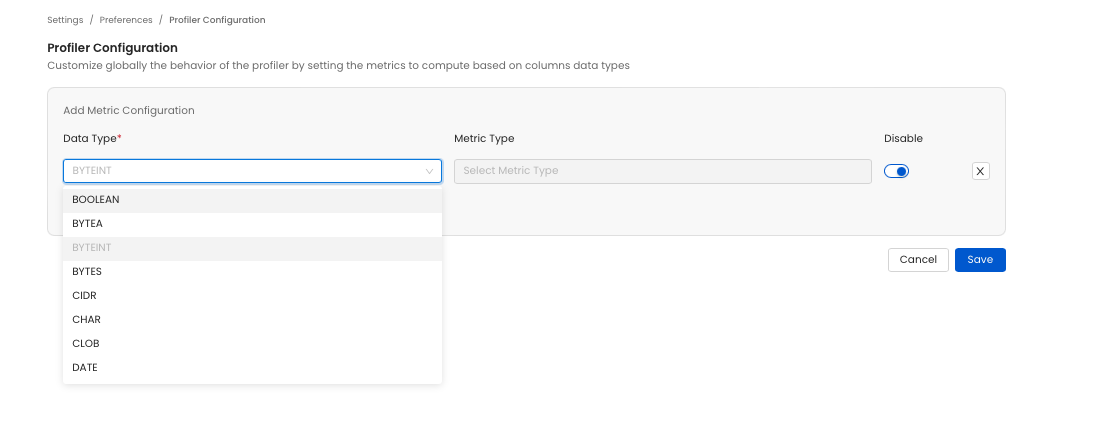
table profile global settings
Disabling Specific Metric Computation for a Data Type Select the data type you want to disable a metric for. Then in the Metric Type section select the metric you to compute (or unselect the ones you don't want to compute). When running the profiler the unselected metric will not be computed.
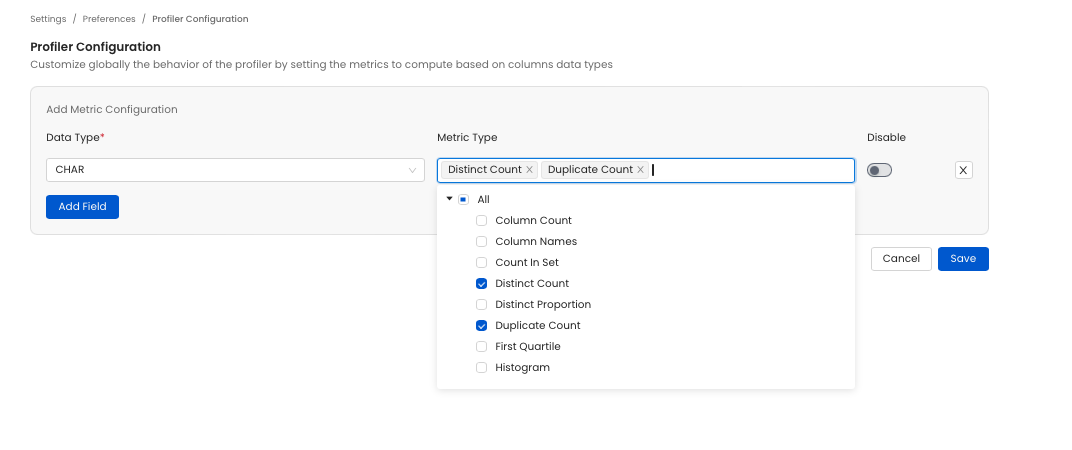
table profile global settings
YAML Configuration
In the connectors section we showcase how to run the metadata ingestion from a JSON file using the Airflow SDK or the CLI via metadata ingest. Running a profiler workflow is also possible using a JSON configuration file.
This is a good option if you which to execute your workflow via the Airflow SDK or using the CLI; if you use the CLI a profile workflow can be triggered with the command metadata profile -c FILENAME.yaml. The serviceConnection config will be specific to your connector (you can find more information in the connectors section), though the sourceConfig for the profiler will be similar across all connectors.
This is a sample config for the profiler:
computeMetrics: Option to turn on/off computing profiler metrics. This flag is useful when you want to only ingest the sample data with the profiler workflow and not any other information.
profileSample: Percentage of data or no. of rows we want to execute the profiler and tests on.
threadCount: Number of threads to use during metric computations.
timeoutSeconds: Profiler Timeout in Seconds
databaseFilterPattern: Regex to only fetch databases that matches the pattern.
schemaFilterPattern: Regex to only fetch tables or databases that matches the pattern.
tableFilterPattern: Regex to only fetch tables or databases that matches the pattern.
Processor Configuration
Choose the orm-profiler. Its config can also be updated to define tests from the YAML itself instead of the UI:
tableConfig: tableConfig allows you to set up some configuration at the table level.
2. Run with the CLI
After saving the YAML config, we will run the command the same way we did for the metadata ingestion:
Note now instead of running ingest, we are using the profile command to select the Profiler workflow.
Profiler Best Practices
When setting a profiler workflow it is important to keep in mind that queries will be running against your database. Depending on your database engine, you may incur costs (e.g., Google BigQuery, Snowflake). Execution time will also vary depending on your database engine computing power, the size of the table, and the number of columns. Given these elements, there are a few best practices we recommend you follow.
1. Profile what you Need
Profiling all the tables in your data platform might not be the most optimized approach. Profiled tables give an indication of the structure of the table, which is most useful for tables where this information is valuable (e.g., tables used by analysts or data scientists, etc.).
When setting up a profiler workflow, you have the possibility to filter out/in certain databases, schemas, or tables. Using this feature will greatly help you narrow down which table you want to profile.
2. Sampling and Partitioning your Tables
On a table asset, you have the possibility to add a sample percentage/rows and a partitioning logic. Doing so will significantly reduce the amount of data scanned and the computing power required to perform the different operations.
For sampling, you can set a sampling percentage at the workflow level.
3. Excluding/Including Specific Columns/Metrics
By default, the profiler will compute all the metrics against all the columns. This behavior can be fine-tuned only to include or exclude specific columns and specific metrics.
For example, excluding id columns will reduce the number of columns against which the metrics are computed.
4. Set Up Multiple Workflow
If you have a large number of tables you would like to profile, setting up multiple workflows will help distribute the load. It is important though to monitor your instance CPU, and memory as having a large amount of workflow running simultaneously will require an adapted amount of resources.