Profiler Metrics
Here you can find information about the supported metrics for the different types.
A Metric is a computation that we can run on top of a Table or Column to receive a value back. They are the primary building block of OpenMetadata's Profiler.
- Metrics define the queries and computations generically. They do not aim at specific columns or database dialects. Instead, they are expressions built with SQLAlchemy that should run everywhere.
- A Profiler is the binding between a set of metrics and the external world. The Profiler contains the Table and Session information and is in charge of executing the metrics.
On this page, you will learn all the metrics that we currently support and their meaning. We will base all the namings on the definitions on the JSON Schemas.
You can check the definition of the columnProfile here. On the other hand, the metrics are implemented here.
We will base all the namings on the definitions on the JSON Schemas.
Table Metrics
Those are the metrics computed at the Table level.
Row Count
It computes the number of rows in the Table.
Column Count
Returns the number of columns in the Table.
System Metrics
System metrics provide information related to DML operations performed on the table. These metrics present a concise view of your data freshness. In a typical data processing flow tables are updated at a certain frequency. Table freshness will be monitored by confirming a set of operations has been performed against the table. To increase trust in your data assets, OpenMetadata will monitor the INSERT, UPDATE and DELETE operations performed against your table to showcase 2 metrics related to freshness (see below for more details). With this information, you are able to see when a specific operation was last perform and how many rows it affected.
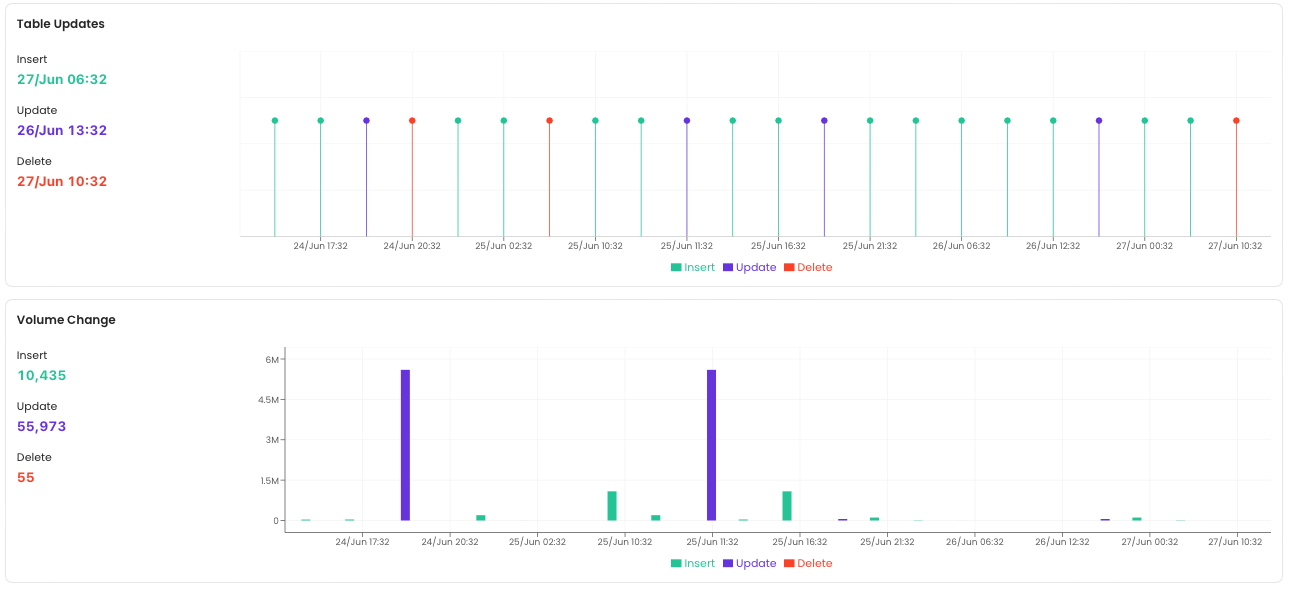
table profile freshness metrics
These metrics are available for BigQuery, Redshift and Snowflake. Other database engines are currently not supported so the computation of the system metrics will be skipped.
DML Operations
This metrics shows all the DML operations performed (INSERT, UPDATE, DELETE) against the table in a timeseries fashion.
Rows Affected by the DML Operation
This metrics shows the number of rows that were affected by a DML operation (INSERT, UPDATE, DELETE) over time.
Column Metrics
List of Metrics that we run for all the columns.
Note that for now we are not supporting complex types such as ARRAY or STRUCT. The implementation will come down the road.
Values Count
It is the total count of the values in the column. Ignores nulls.
Values Percentage
Percentage of values in this column vs. the Row Count.
Duplicate Count
Informs the number of rows that have duplicated values in a column. We compute it as count(col) - count(distinct(col)).
Null Count
The number of null values in a column.
Null Proportion
It shows the ratio of null values vs. the total number of values in a column.
Unique Count
The number of unique values in a column, those that appear only once. E.g., [1, 2, 2, 3, 3, 4] => [1, 4] => count = 2.
Unique Proportion
Unique Count / Values Count
Distinct Count
The number of different items in a column. E.g., [1, 2, 2, 3, 3, 4] => [1, 2, 3, 4] => count = 4.
Distinct Proportion
Distinct Count / Values Count
Min
Only for numerical values. Returns the minimum.
Max
Only for numerical values. Returns the maximum.
Min Length
Only for concatenable values. Returns the minimum length of the values in a column.
Max Length
Only for concatenable values. Returns the maximum length of the values in a column.
Mean
- Numerical values: returns the average of the values.
- Concatenable values: returns the average length of the values.
Median
Only for numerical values. This is currently not supported in MySQL.
Sum
Only for numerical values. Returns the sum of all values in a column.
Standard Deviation
Only for numerical values. Returns the standard deviation.
Histogram
The histogram returns a dictionary of the different bins and the number of values found for that bin. It will be computed only if the Inter Quartile Range value is available
First Quartile
Only for numerical values. Middle number between the smallest value and the median
Third Quartile
Only for numerical values. Middle number between the median and the greatest value
Inter Quartile Range
Only for numerical values. Difference between the third quartile and the first quartile
Nonparametric Skew
Measure of skewness of the column distribution. Nonparametric skew is computed as follow $$ S = \frac{\mu-\tilde{\mu}}{\sigma} $$
Where
$$ \mu = mean\ \tilde{\mu} = median\ \sigma = standard deviation\ $$
Grant Access to User for System Metrics
OpenMetadata uses system tables to compute system metrics. You can find the required access as well as more details for your database engine below.
Snowflake
OpenMetadata uses the QUERY_HISTORY_BY_WAREHOUSE view of the INFORMATION_SCHEMA to collect metrics about DML operations. To collect information about the RESULT_SCAN command alongside the QUERY ID will be passed to the RESULT_SCAN function to get the number of rows affected by the operation. You need to make sure the user running the profiler workflow has access to this view and this function.
OpenMetadata will look at the past 24-hours to fetch the operations that were performed against a table.
Important
For snowflake system, the system will parse the DDL query and attempt to match database, schema, and table name to entities in OpenMetadata. If the DDL query does not include all 3 elements we will not be able to ingest this metric.
Redshift
OpenMetadata uses stl_insert, stl_delete, svv_table_info, and stl_querytext to fetch DML operations as well as the number of rows affected by these operations. You need to make sure the user running the profiler workflow has access to these views and tables.
OpenMetadata will look at the previous day to fetch the operations that were performed against a table.
BigQuery
Bigquery uses the JOBS table of the INFORMATION_SCHEMA to fetch DML operations as well as the number of rows affected by these operations. You will need to make sure your data location is properly set when creating your BigQuery service connection in OpenMetadata.
OpenMetadata will look at the previous day to fetch the operations that were performed against a table filter on the creation_time partition field to limit the size of data scanned.
Reach out!
Is there any metric you'd like to see? Open an issue or reach out on Slack.