Data Observability Alerts
Monitor the health of your data systems by setting up alerts for pipeline failures, data quality issues, and schema changes.
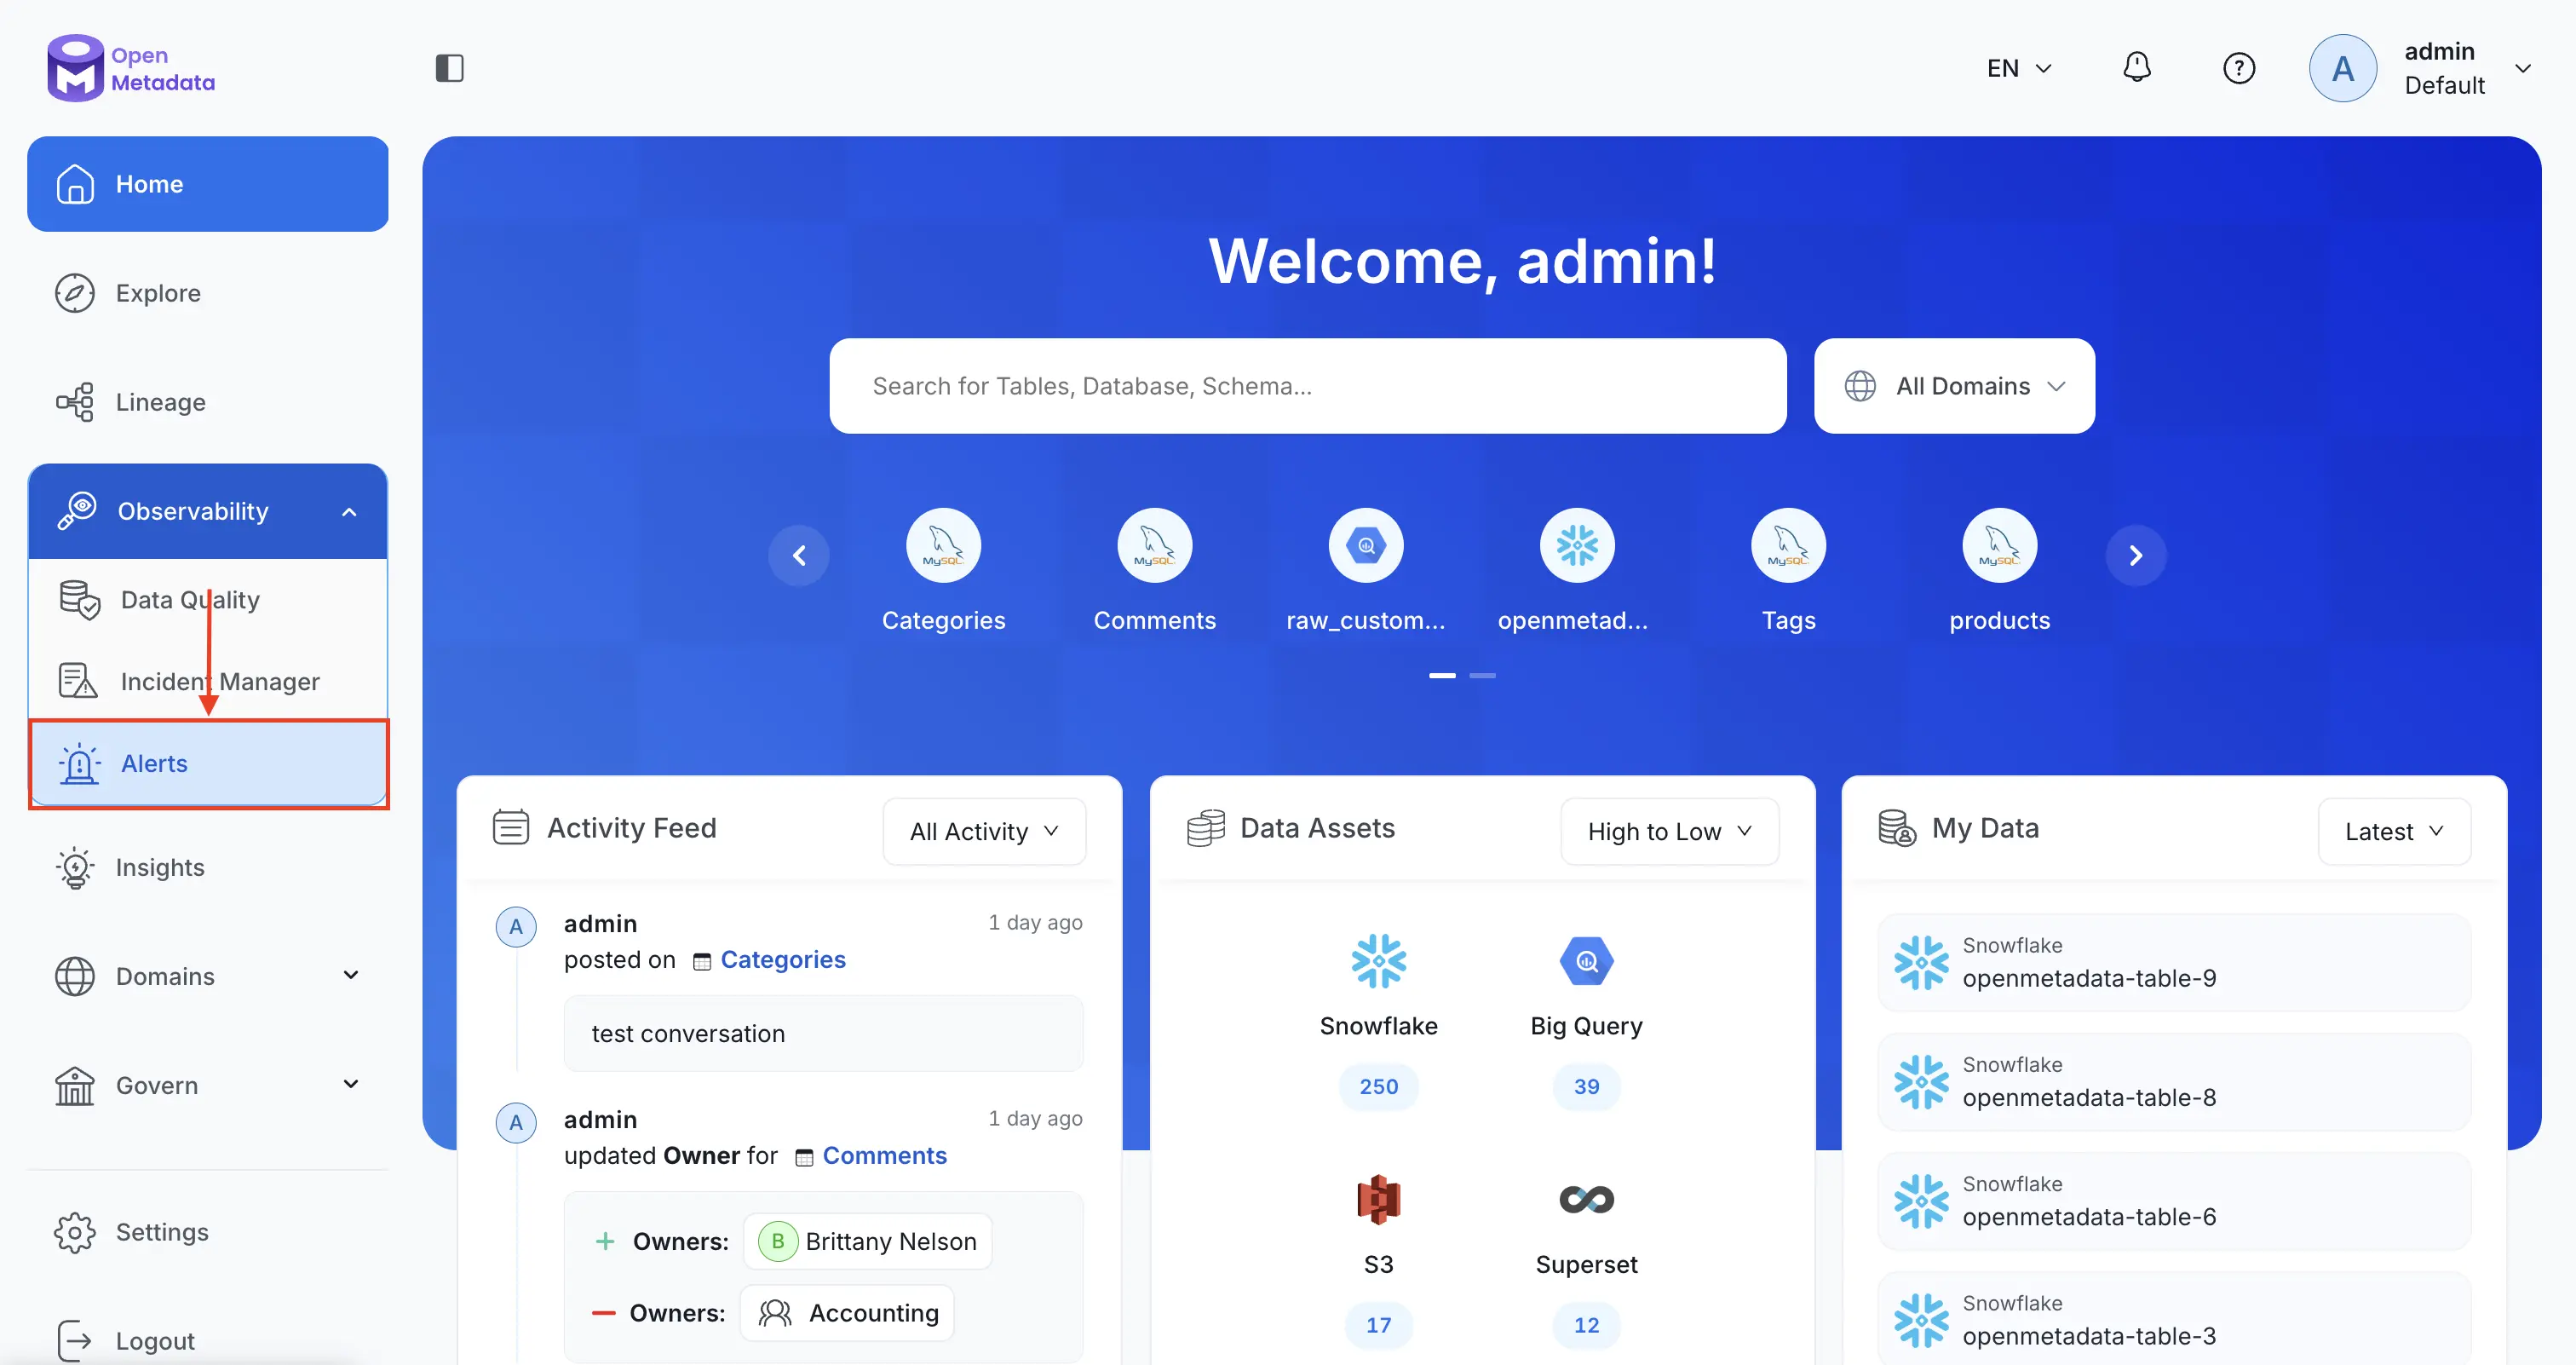
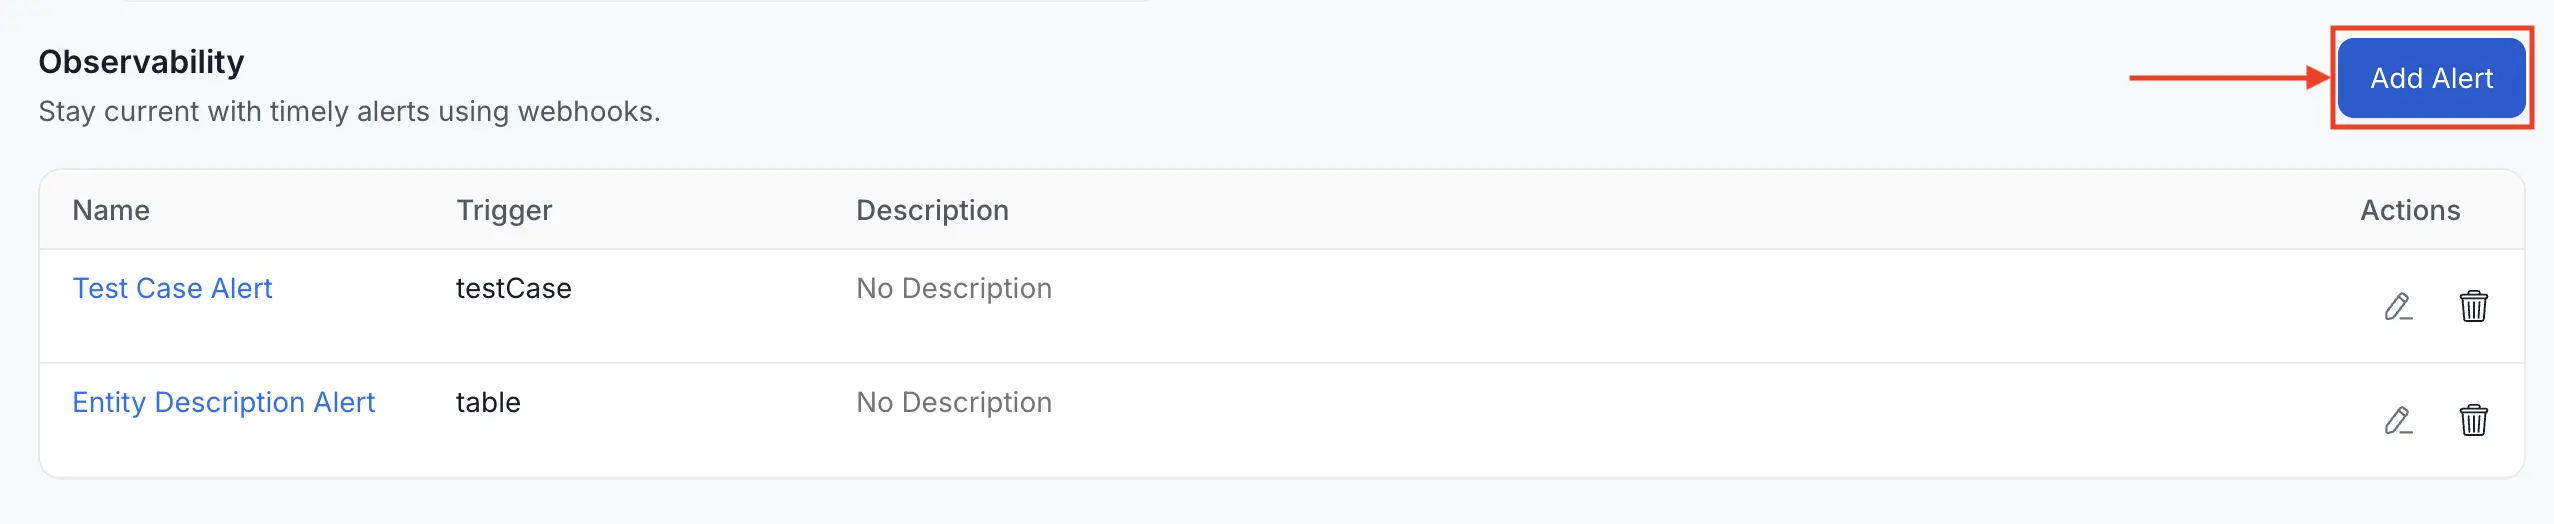
Navigate to Observability Alerts
Name the Alert and Add Context
Provide a unique, descriptive Name for your alert. You can also add an optional Description to provide further context and clarity regarding the alert's intent.
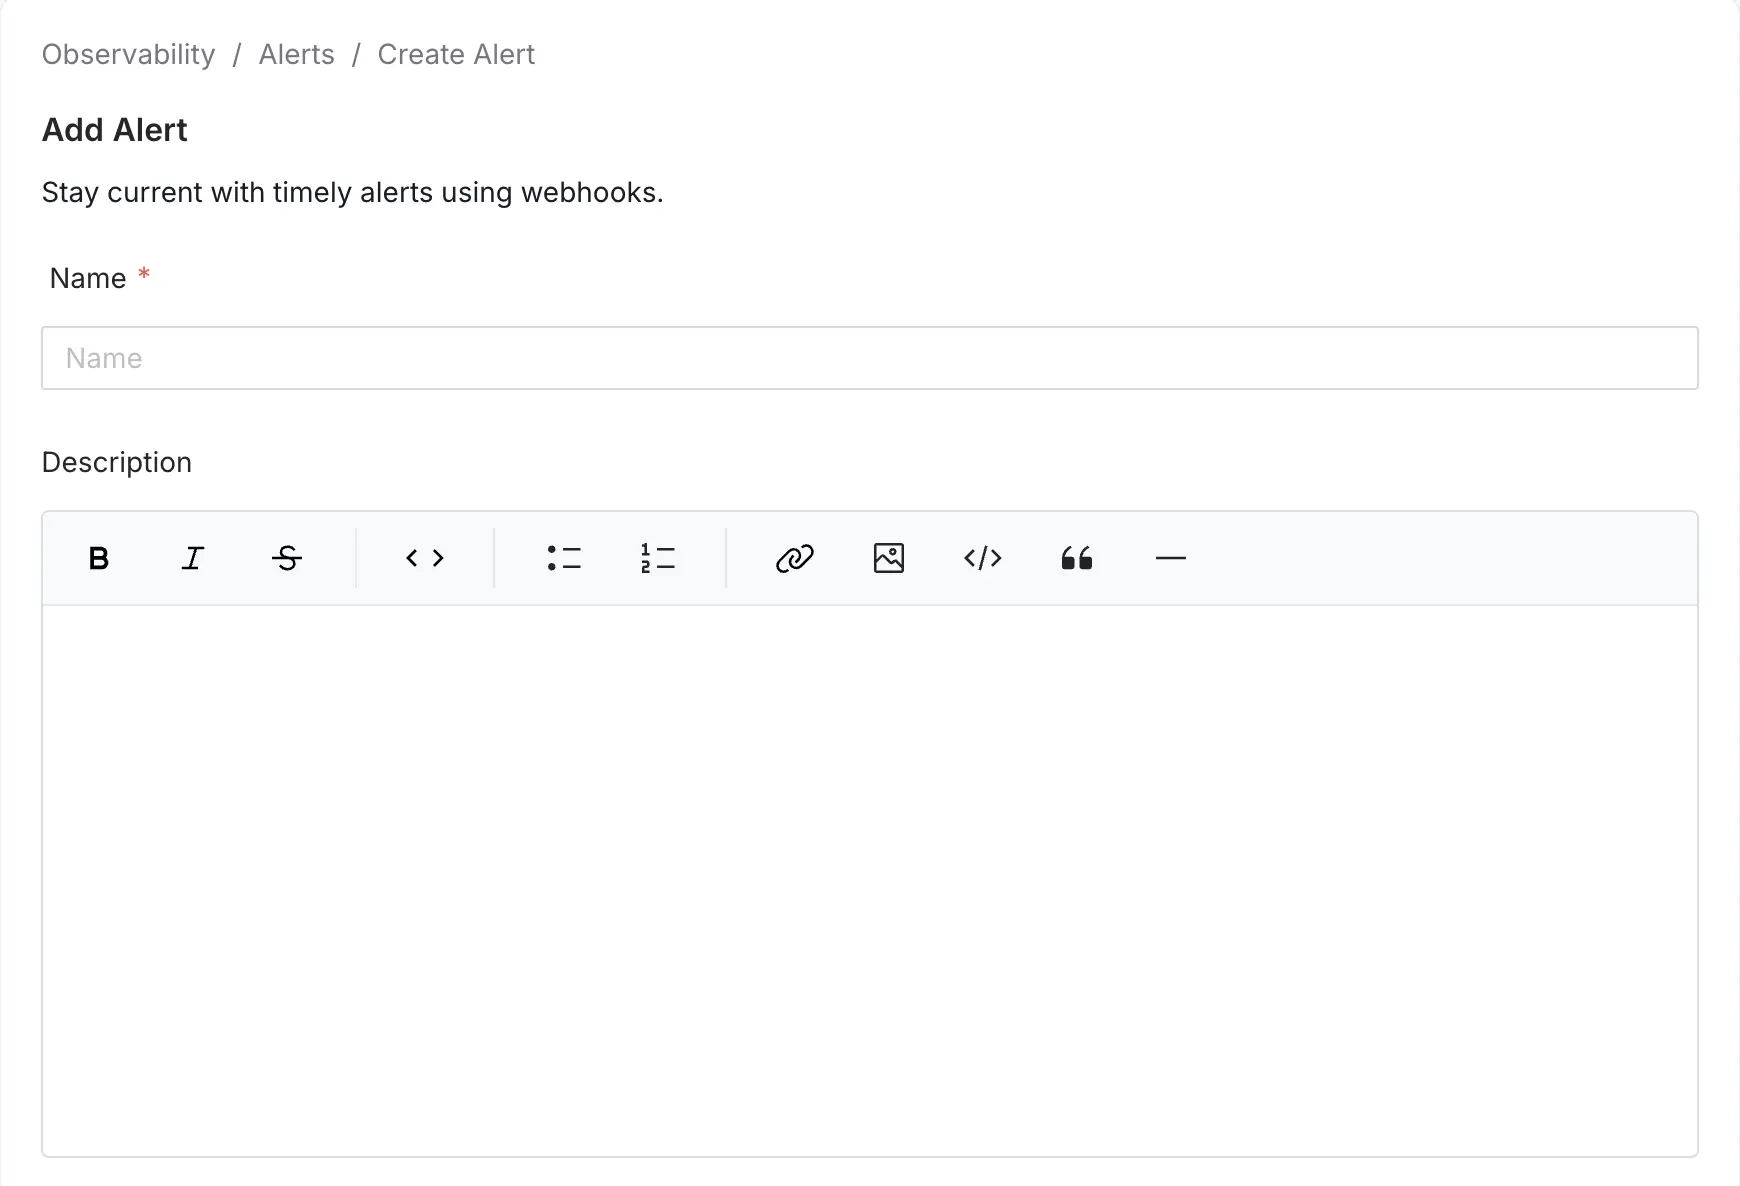
Define the Alert Name and Optional Description
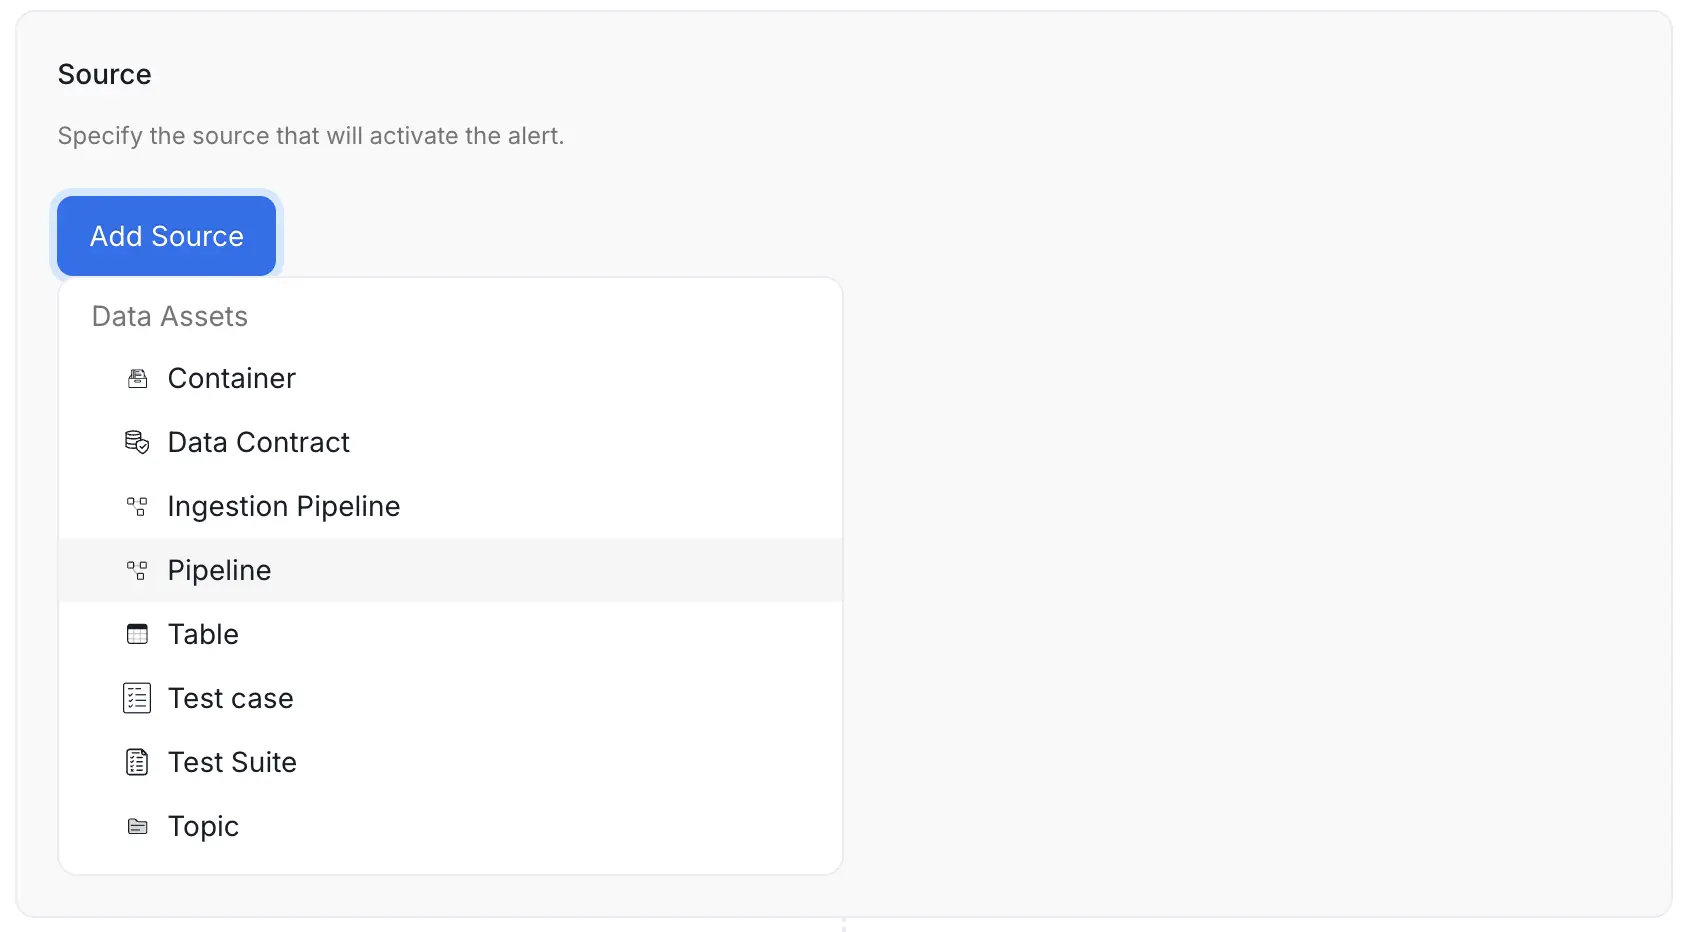
Select a Source
Choose the operational entity you want to monitor:
- Container - Monitors schema changes for the container asset
- Pipeline - Monitors updates to pipeline assets that you have ingested
- Table - Monitors schema changes and table metrics changes
- Test Case - Triggers an alert for the specific test case selected
- Test Suite - Triggers an alert for any test case event linked to the test suite. This is a great way to group alerts and reduce notification fatigue
- Topic - Monitors schema changes for the topic asset
Select the Source Resource
Configure Filters (Optional)
Filters allow you to refine the scope of the alert to focus only on relevant changes, significantly improving the signal-to-noise ratio. You can narrow down events based on a variety of criteria, including:
- Entity Specific Name: Filter by the defined specific name of the entity.
- Owner Name: Filter events based on the designated owner of the asset.
- Domain: Filter events based on the Data Domain the entity belongs to.
- Filter By Updater Is Bot: Filter to include or exclude changes made by automated ingestion or system processes.
Use the Include toggle to define the logic for the filter condition:
- Include (Toggle ON): If the event meets the filter condition, the alert is sent.
- Exclude (Toggle OFF): If the event meets the filter condition, the alert is silenced (not sent).
If you do not set any filter, the alert will apply to all relevant events over the selected source entity type, which may lead to excessive notifications.
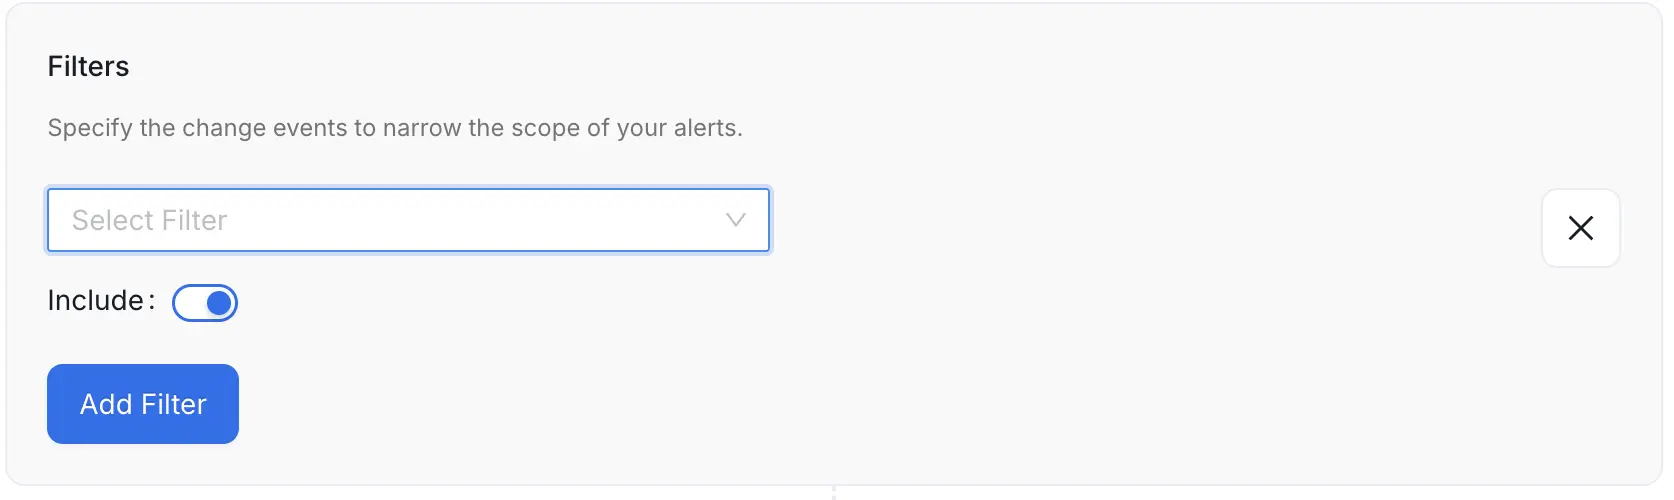
Define Filters
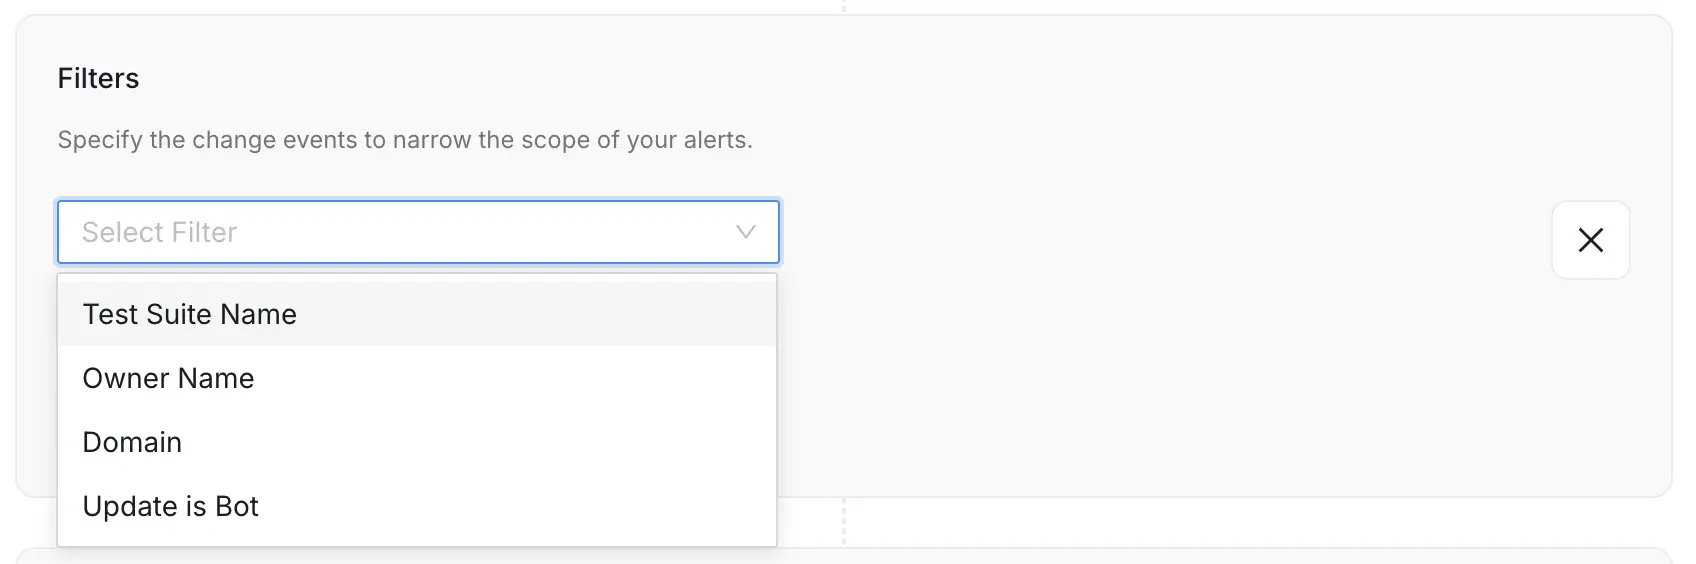
Filtering options for TestSuite source Entity.
Select Trigger Conditions (Optional)
Define the specific conditions that will trigger the alert:
- Schema Changes - Alert on added, deleted, or updated columns
- Test Case Status - Trigger when tests are
Failed,Aborted, orQueued - Pipeline Status - Alert when pipeline execution is
FailedorPending - Metric Updates - Notify when table metrics are updated
You can select multiple trigger conditions to create comprehensive monitoring coverage.
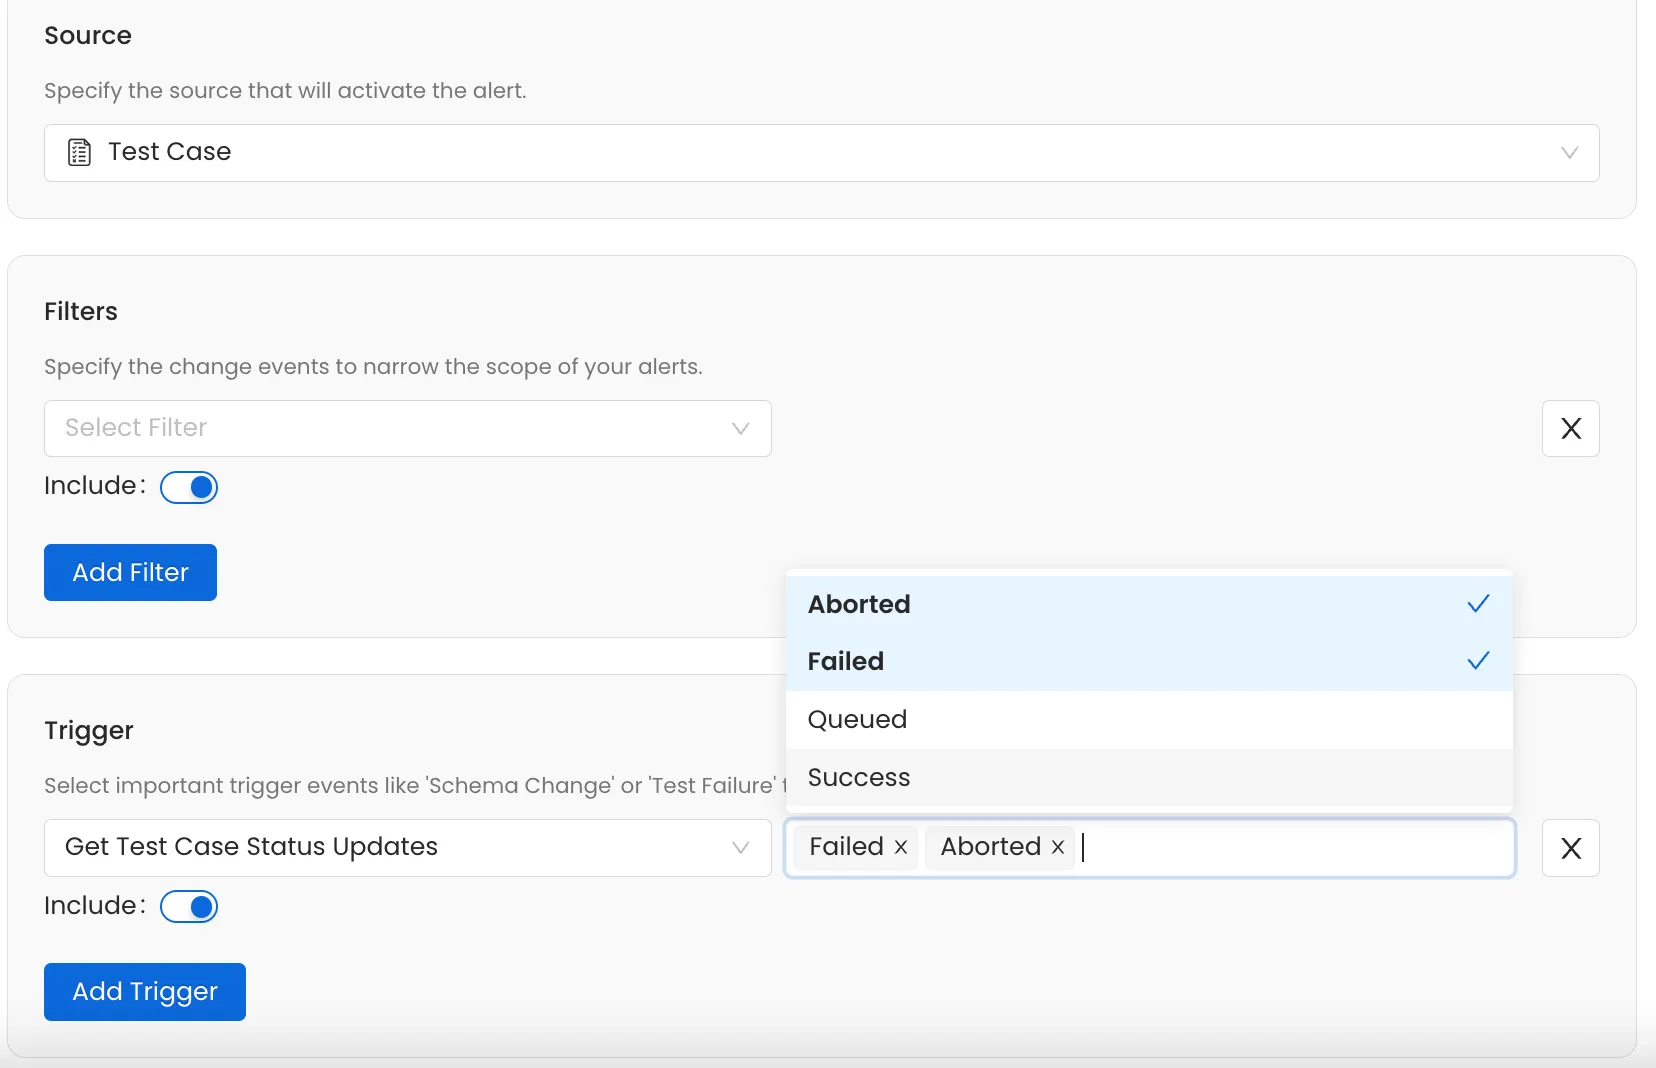
Select Trigger Conditions
Select Destinations
Choose where to send your alerts. OpenMetadata supports both internal and external channels.
Internal Destinations:
- Admins - Notify all platform administrators
- Followers - Notify users following the asset
- Owners - Alert the asset owners
- Teams or Specific Users - Target specific teams or individuals
External Destinations:
- Chat: Slack, MS Teams, Google Chat
- Automation: Generic Webhooks
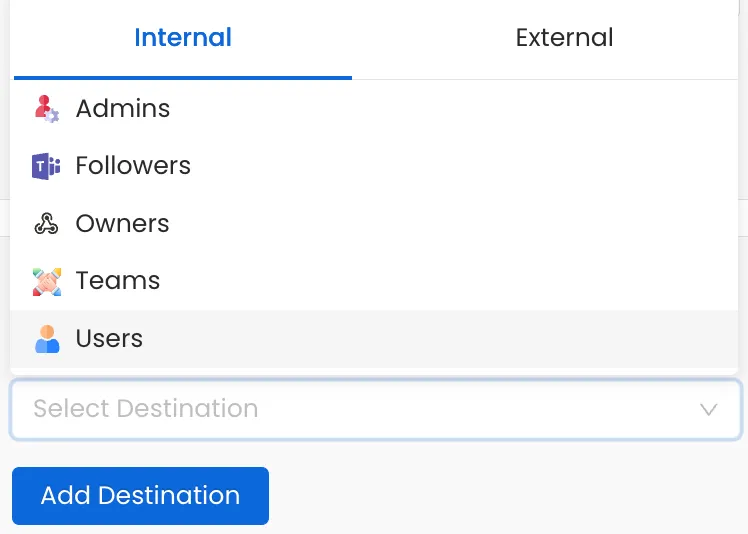
Internal Destinations
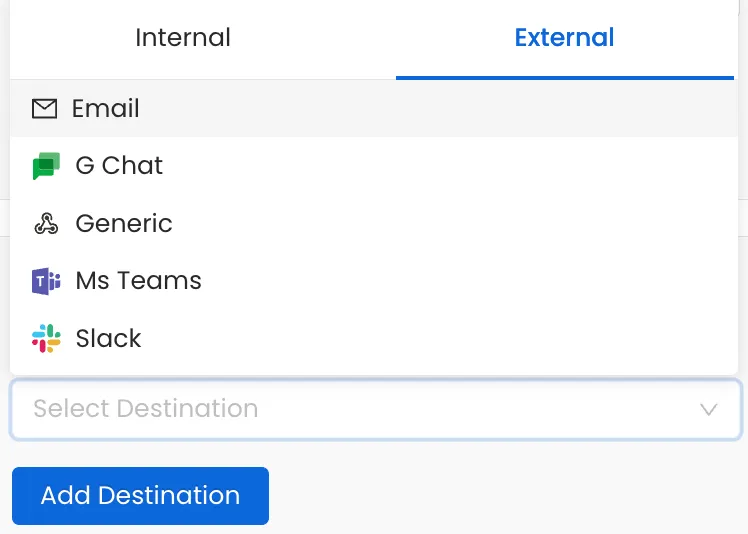
External Destinations