Dimensional Validation
Dimensional validation allows you to run data quality tests grouped by business dimensions, helping you identify which segments of your data contain quality issues. Instead of getting a single pass/fail result for an entire column, you can see test results broken down by region, product category, customer type, or any other dimension that matters to your business.
What is Dimensional Validation?
When you run a standard data quality test in OpenMetadata, you get a single result that tells you whether your entire column meets your quality criteria. For example, a "Column Values to be Not Null" test might tell you that 95% of your data is valid across 10 million rows.
Dimensional validation enhances this by grouping your test results by a dimension column. Using the same example, instead of just knowing that 95% is valid overall, you can also see:
- North America region: 99% valid (excellent)
- Europe region: 97% valid (good)
- Asia Pacific region: 88% valid (needs attention)
- Latin America region: 92% valid (acceptable)
This granular view helps you quickly identify problem areas in your data and take targeted action. You can focus your data quality improvements on the specific regions, products, or business segments that need the most attention.
Dimensional validation works with all column-level tests in OpenMetadata. You can dimension your tests by any categorical column in your table—such as geographic regions, product types, customer segments, or time periods. The feature automatically computes metrics for each dimension and ranks them by impact score, so you always see the most critical issues first.
Dimensional validation is only available for column-level tests. Table-level tests (such as row count checks or table-wide comparisons) do not support dimensional validation since they operate on the entire table rather than individual column values.
Key Concepts
Before setting up dimensional validation, it's helpful to understand these core concepts:
Dimension Column
The dimension column is the column you use to group your test results. This should be a categorical column with meaningful business values—such as region, department, product_category, or order_status. When you run a dimensional test, OpenMetadata automatically groups your data by unique values in this column and computes test metrics separately for each group.
For example, if you choose "region" as your dimension column, and your region column contains values like "North America", "Europe", and "Asia Pacific", you'll get separate test results for each of these regions.
Dimension Group
A dimension group is one unique value in your dimension column. In the region example above, "North America" is one dimension group, "Europe" is another, and so on. OpenMetadata shows you metrics for each dimension group, helping you understand how data quality varies across your business segments.
Top Dimensions
By default, OpenMetadata shows you the top 10 dimensions ranked by impact score. These are the dimension groups with the most significant data quality issues. The impact score is calculated based on both the number of failing rows and the proportion of data affected. This ensures that you see the dimensions that matter most, whether they have high failure counts or high failure rates.
"Others" Group
If your dimension column has more than 10 unique values, OpenMetadata automatically creates an "Others" group that combines all dimensions outside the top 10. This keeps your results focused on the most important issues while still providing complete coverage of your data.
For example, if you have 50 product categories, you'll see:
- The top 10 categories with the worst data quality
- An "Others" group representing the remaining 40 categories combined
The metrics for the "Others" group are accurately calculated across all included dimensions, giving you a true picture of data quality in your long-tail segments.
Cardinality
Cardinality refers to the number of unique values in your dimension column. A region column with 5 values (North America, Europe, Asia, etc.) has low cardinality. A customer_id column with 1 million unique values has high cardinality.
Cardinality is crucial for performance. Dimensional validation works best with low cardinality. High cardinality dimensions can cause significant performance overhead and longer execution times.
Recommended cardinality range: 5-25 unique values for optimal performance. Avoid using high-cardinality columns like customer_id, order_id, or timestamps as dimension columns.
When to Use Dimensional Validation
Dimensional validation is most valuable when you need to understand where data quality issues are occurring, not just whether they exist. Here are common scenarios where dimensional validation provides the most value:
Multi-Region or Multi-Location Data
If your organization operates across multiple regions, countries, or locations, dimensional validation helps you identify location-specific data quality issues. You might discover that data from a specific warehouse has higher null rates, or that records from a particular country have formatting problems.
Example: A retail company discovers that null values in the customer_email column occur 10x more frequently in their Latin America region compared to other regions, indicating a regional data collection issue.
Product or Category Analysis
When you manage multiple product lines, brands, or categories, dimensional validation reveals product-specific quality patterns. This is especially valuable for companies with diverse product catalogs where data quality requirements may vary by product type.
Example: An e-commerce platform finds that electronics products have 95% complete descriptions, while clothing products only have 70% complete descriptions, allowing them to focus content improvement efforts.
Customer Segment Quality
For customer-facing data, dimensional validation by customer type, subscription tier, or user segment reveals whether quality issues affect specific customer groups. This helps you prioritize fixes that impact your most valuable customers.
Example: A SaaS company discovers that free-tier users have 30% incomplete profile data, while enterprise customers have 99% complete profiles, validating their assumption that enterprise onboarding processes are more effective.
When NOT to Use Dimensional Validation
Dimensional validation adds computational overhead and is not appropriate in all situations:
- When you only need yes/no answers: If you just need to know whether data meets basic quality standards, standard tests are more efficient
- High-cardinality columns: Avoid using columns with >100 unique values as dimensions—performance will degrade significantly
- Very large tables without optimization: For tables >500GB, use sampling or partitioning strategies
- When dimension doesn't provide business value: Only add dimensional validation when the grouping provides actionable insights
Quick Start Guide
This guide walks you through creating your first dimensional test from the OpenMetadata UI and will focus only on the specifics of the dimensional tests.
Step 1: Navigate to Your Table
- Go to the table where you want to create a dimensional test
- Click on the Data Observability tab
- Click the Add Test button in the upper right corner
- Select Dimension Level
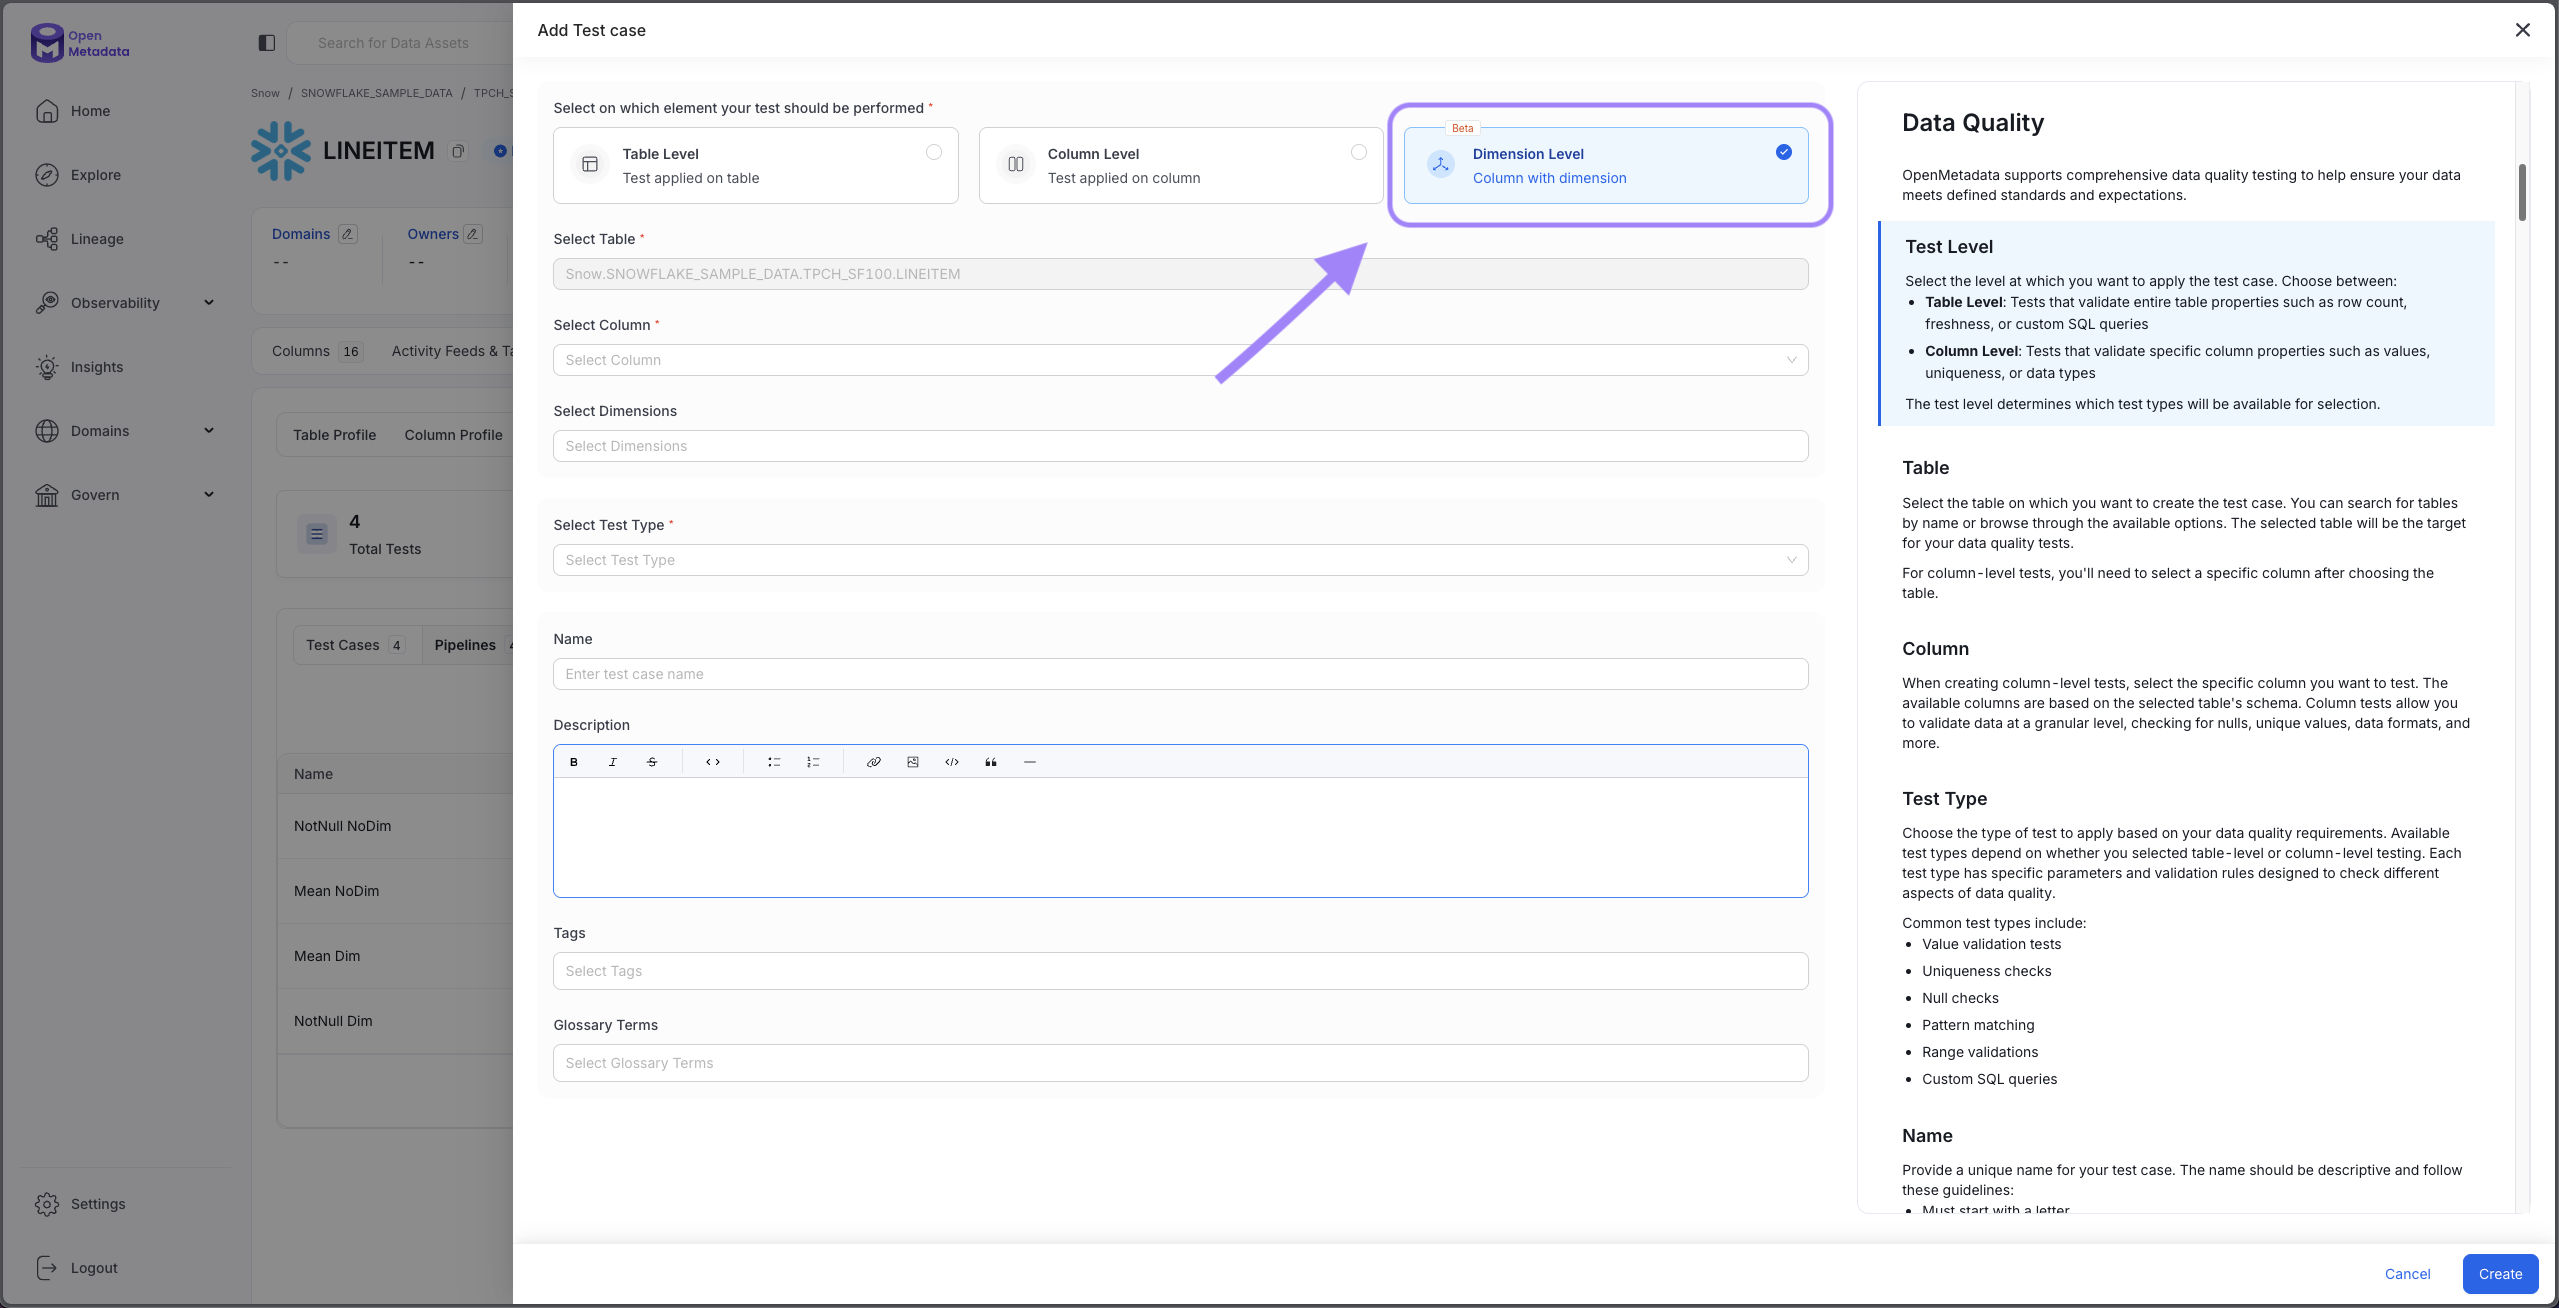
Navigate to Data Observability and add a Dimension Level test
Step 2: Select Column and Test Type
- Choose your target column: Select the column you want to validate (e.g.,
customer_email,order_amount,product_description) - Select the dimension: Select the dimension you are interested in (e.g,
region,status) - Select a test type: Choose from any of the supported column-level tests (see Supported Test Types section)
- Configure test parameters: Set thresholds, ranges, or patterns based on your chosen test type
For example, to test email completeness:
- Column:
customer_email - Dimension:
region - Test Type: Column Values to be Not Null
- Name:
Email Completeness Check
Choose dimension columns with low-to-medium cardinality (5-100 unique values) for best performance. Columns like region, product_type, or order_status work well. Avoid high-cardinality columns like customer_id or order_id.
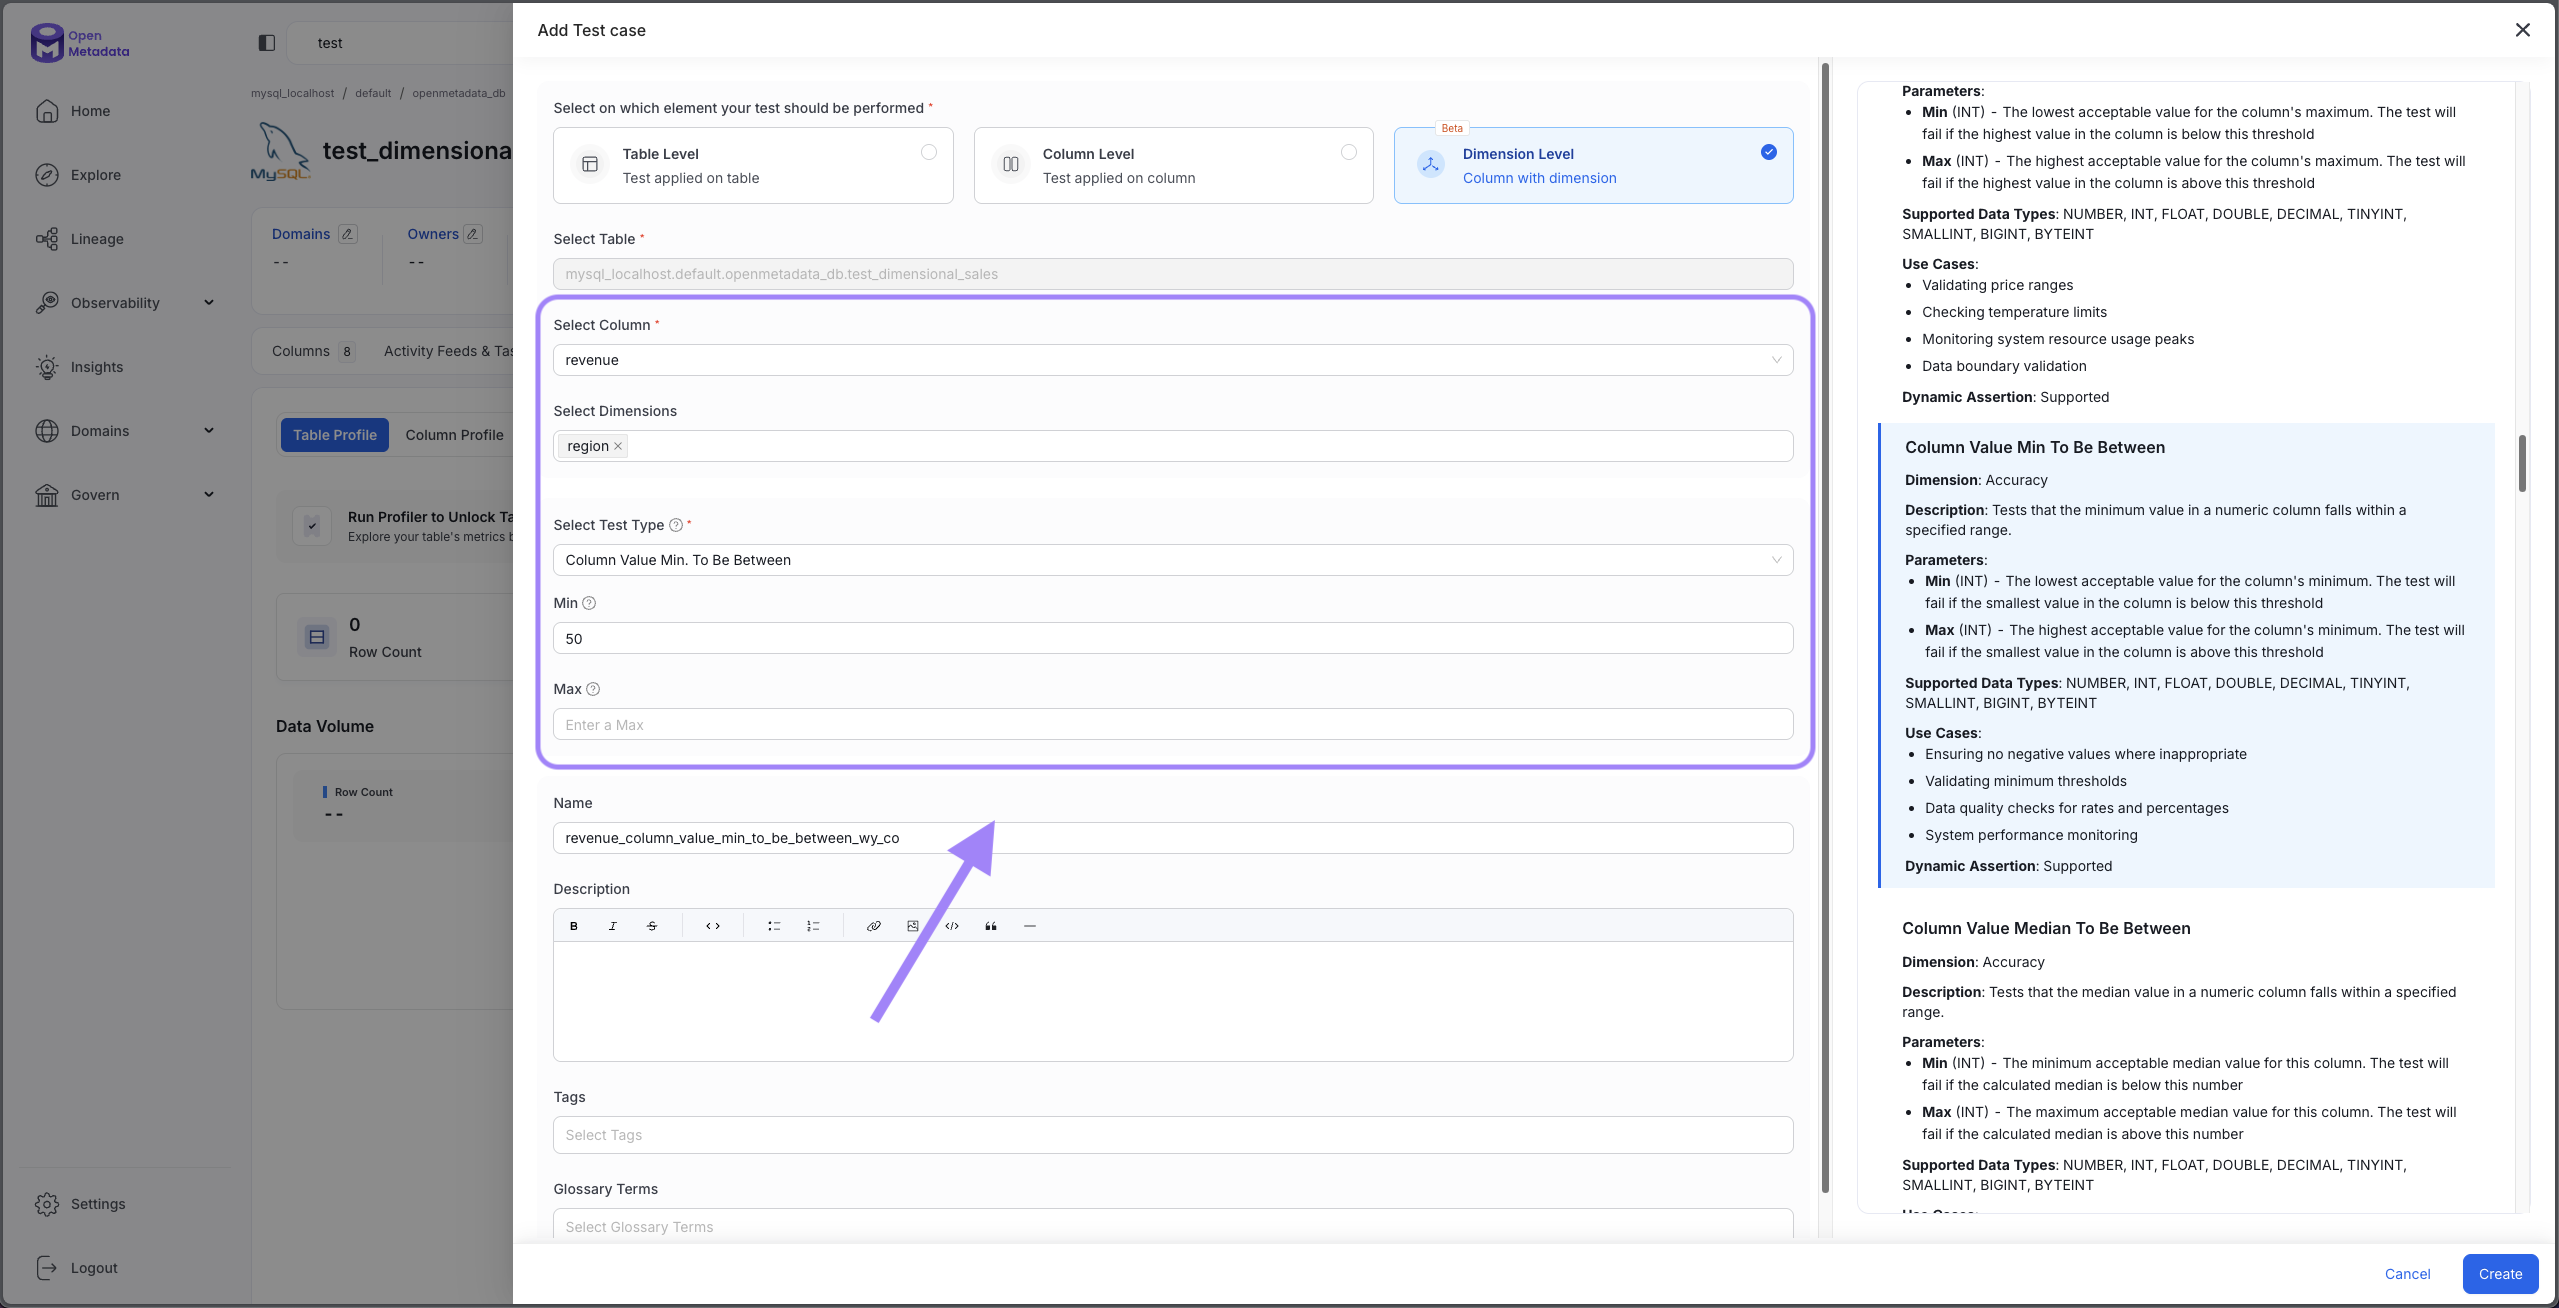
Choose your column, test type, and dimension
Step 3: Finish configuring your test, pipeline and running it
This is exactly the same as with non-dimensional tests. For detailed information on setting up tests, see Adding Test Cases to an Entity and Adding Test Suites
Step 4: View Results
Once your test runs, return to the Data Observability tab to view dimensional results:
- Find your dimensional test in the list
- Click on the test to expand results
- View the Dimensional Results section showing metrics for each dimension group
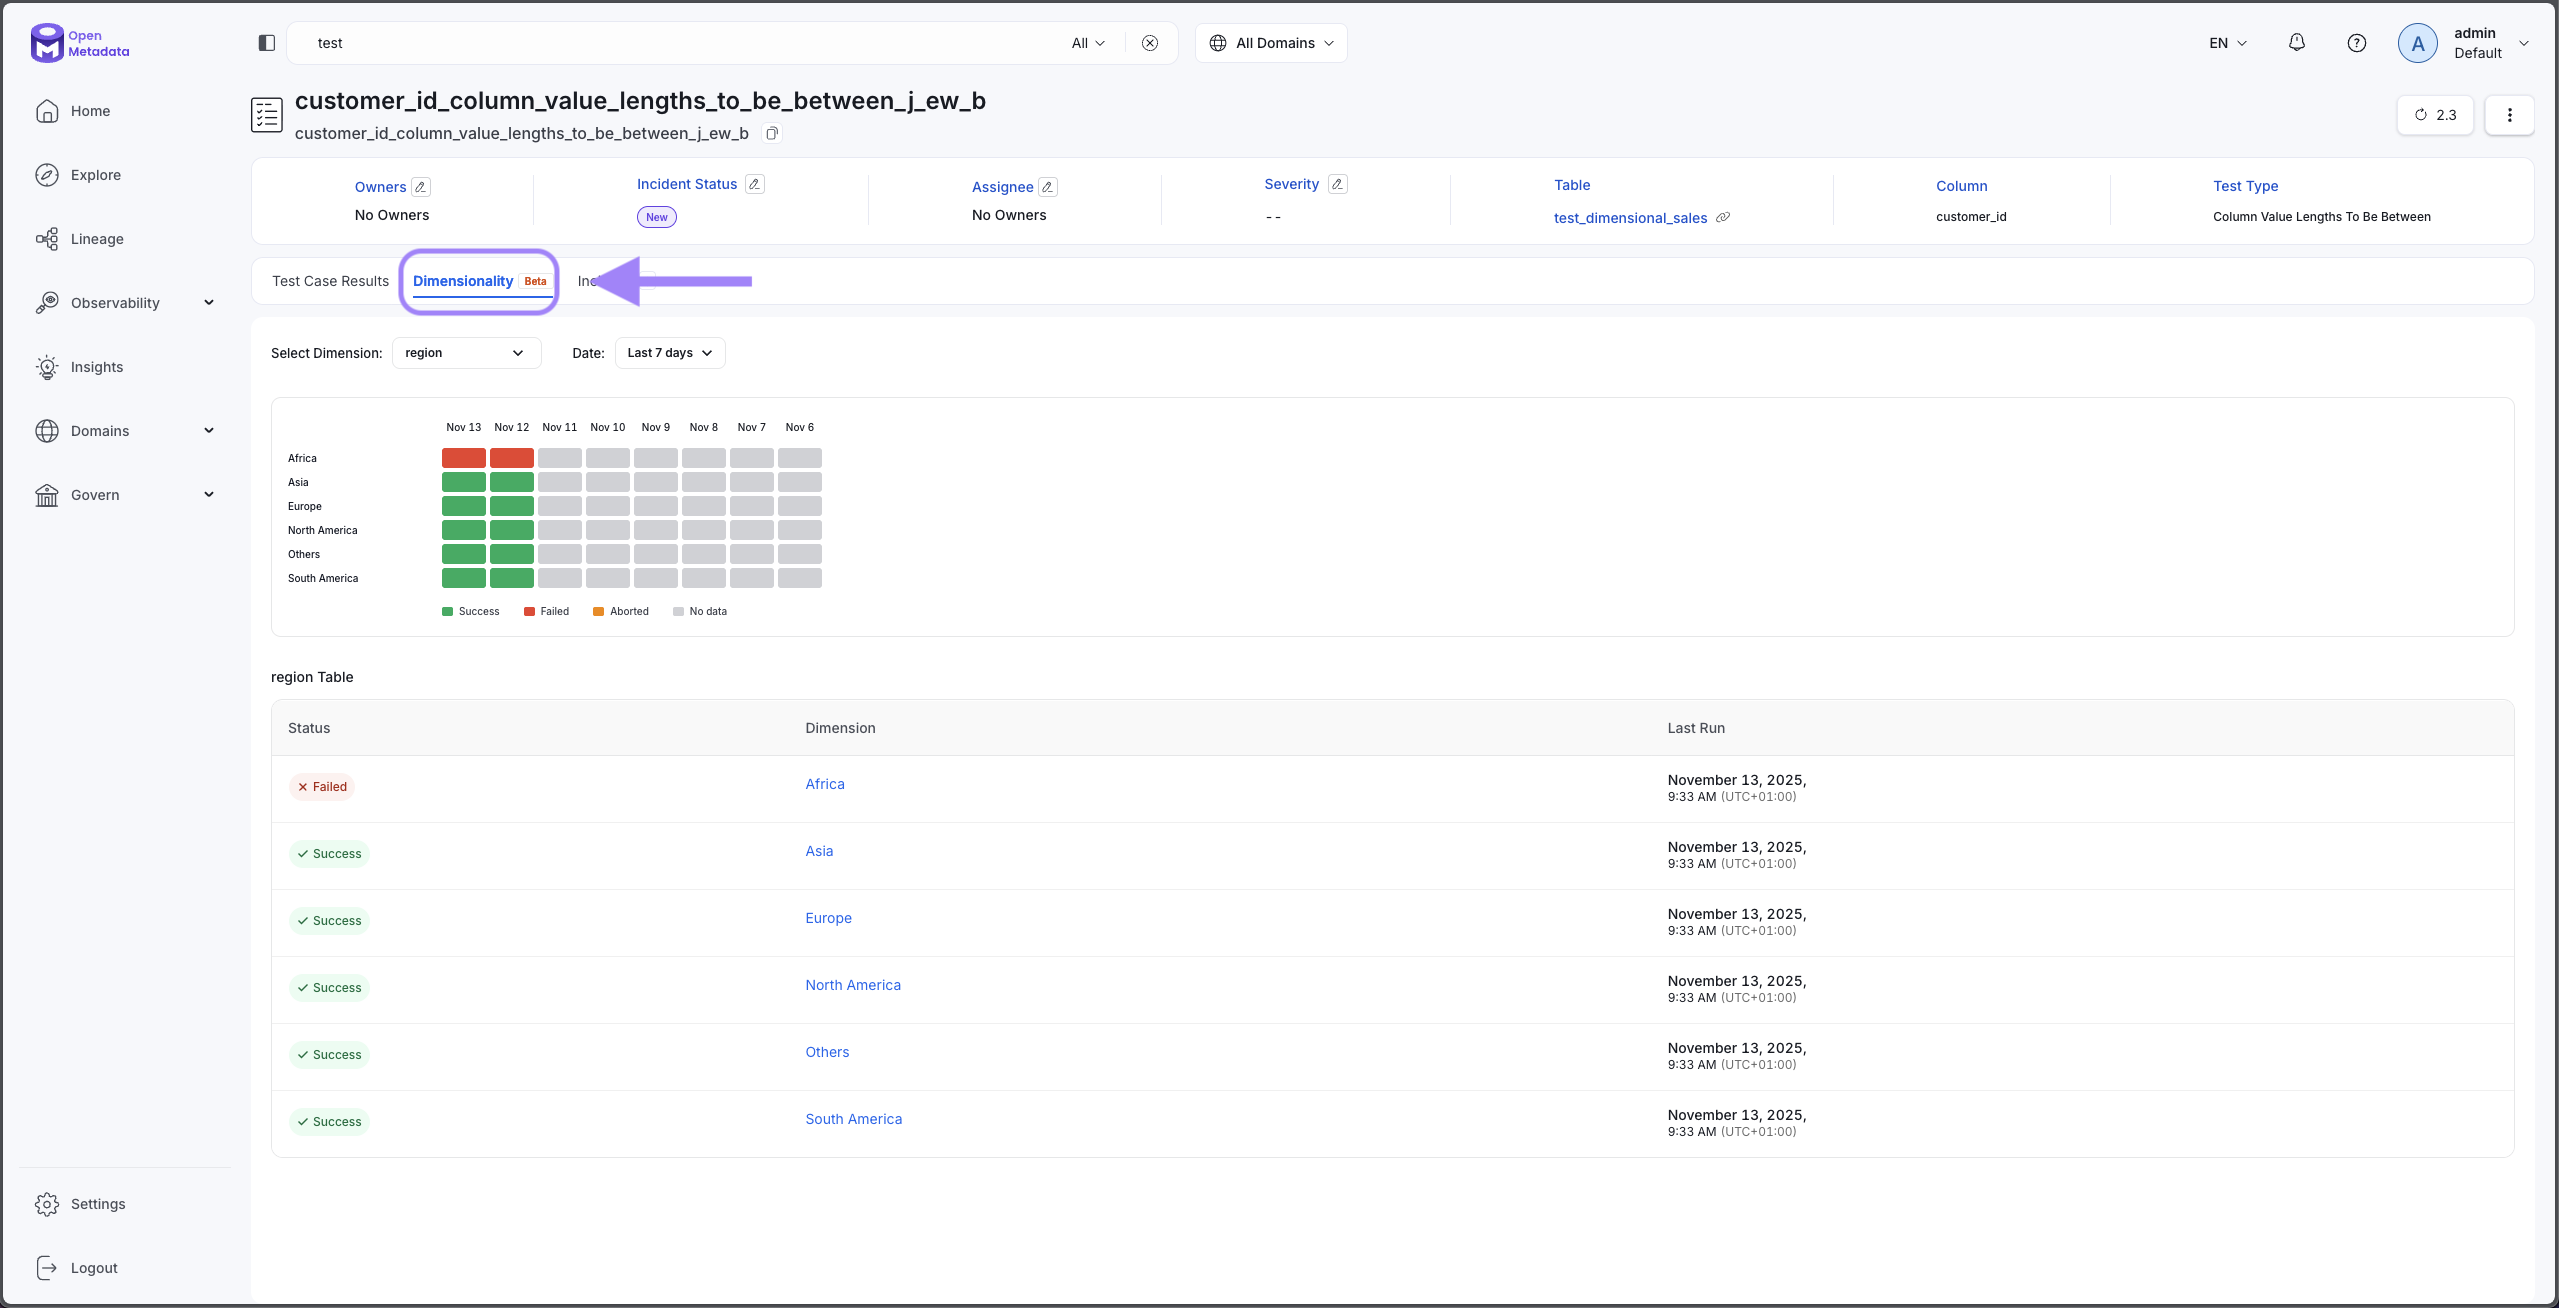
Review test results grouped by dimension
Understanding Results
When you view dimensional test results, OpenMetadata provides detailed metrics for each dimension group to help you understand data quality patterns.
Result Metrics
For each dimension group, you'll see:
Dimension Value: The specific value of the dimension column (e.g., "North America", "Electronics", "Premium Tier")
Total Count: The total number of rows in this dimension group
Failed Count: The number of rows that failed the test criteria in this dimension
Impact Score: A calculated score (0.0 to 1.0) representing the severity of quality issues in this dimension, based on both the failure rate and absolute number of failures
Test-Specific Metrics: Additional metrics vary by test type. For example:
- Not Null tests show null counts
- Mean tests show actual mean values
- Unique tests show duplicate counts
Impact Score Ranking
Dimensional results are automatically sorted by impact score in descending order, ensuring the most critical issues appear first. The impact score algorithm balances:
- Failure rate: What percentage of rows failed in this dimension?
- Absolute volume: How many rows failed in total?
This balanced approach ensures you see both:
- High-failure-rate dimensions that might affect smaller data volumes
- High-volume dimensions where even moderate failure rates represent many problematic rows
For example, if you have:
- Region A: 1,000 rows, 500 failures (50% failure rate, impact score could be: 0.95)
- Region B: 100,000 rows, 20,000 failures (20% failure rate, impact score could be: 0.87)
Region A appears first due to its higher failure rate, but Region B still ranks high due to the large absolute number of failures.
The "Others" Group
If your dimension column has more than 10 unique values, you'll see an "Others" group representing all dimensions outside the top 10:
- Metrics for "Others" are accurately calculated across all included dimensions
- If "Others" shows quality issues, consider investigating which specific values it contains
- You may need to create separate focused tests for specific values in the "Others" group
Historical Trend View
Click on any dimension group to view its quality trend over time:
- See how this dimension's quality has changed across test runs
- Identify whether issues are improving or degrading
- Correlate quality changes with business events or system changes
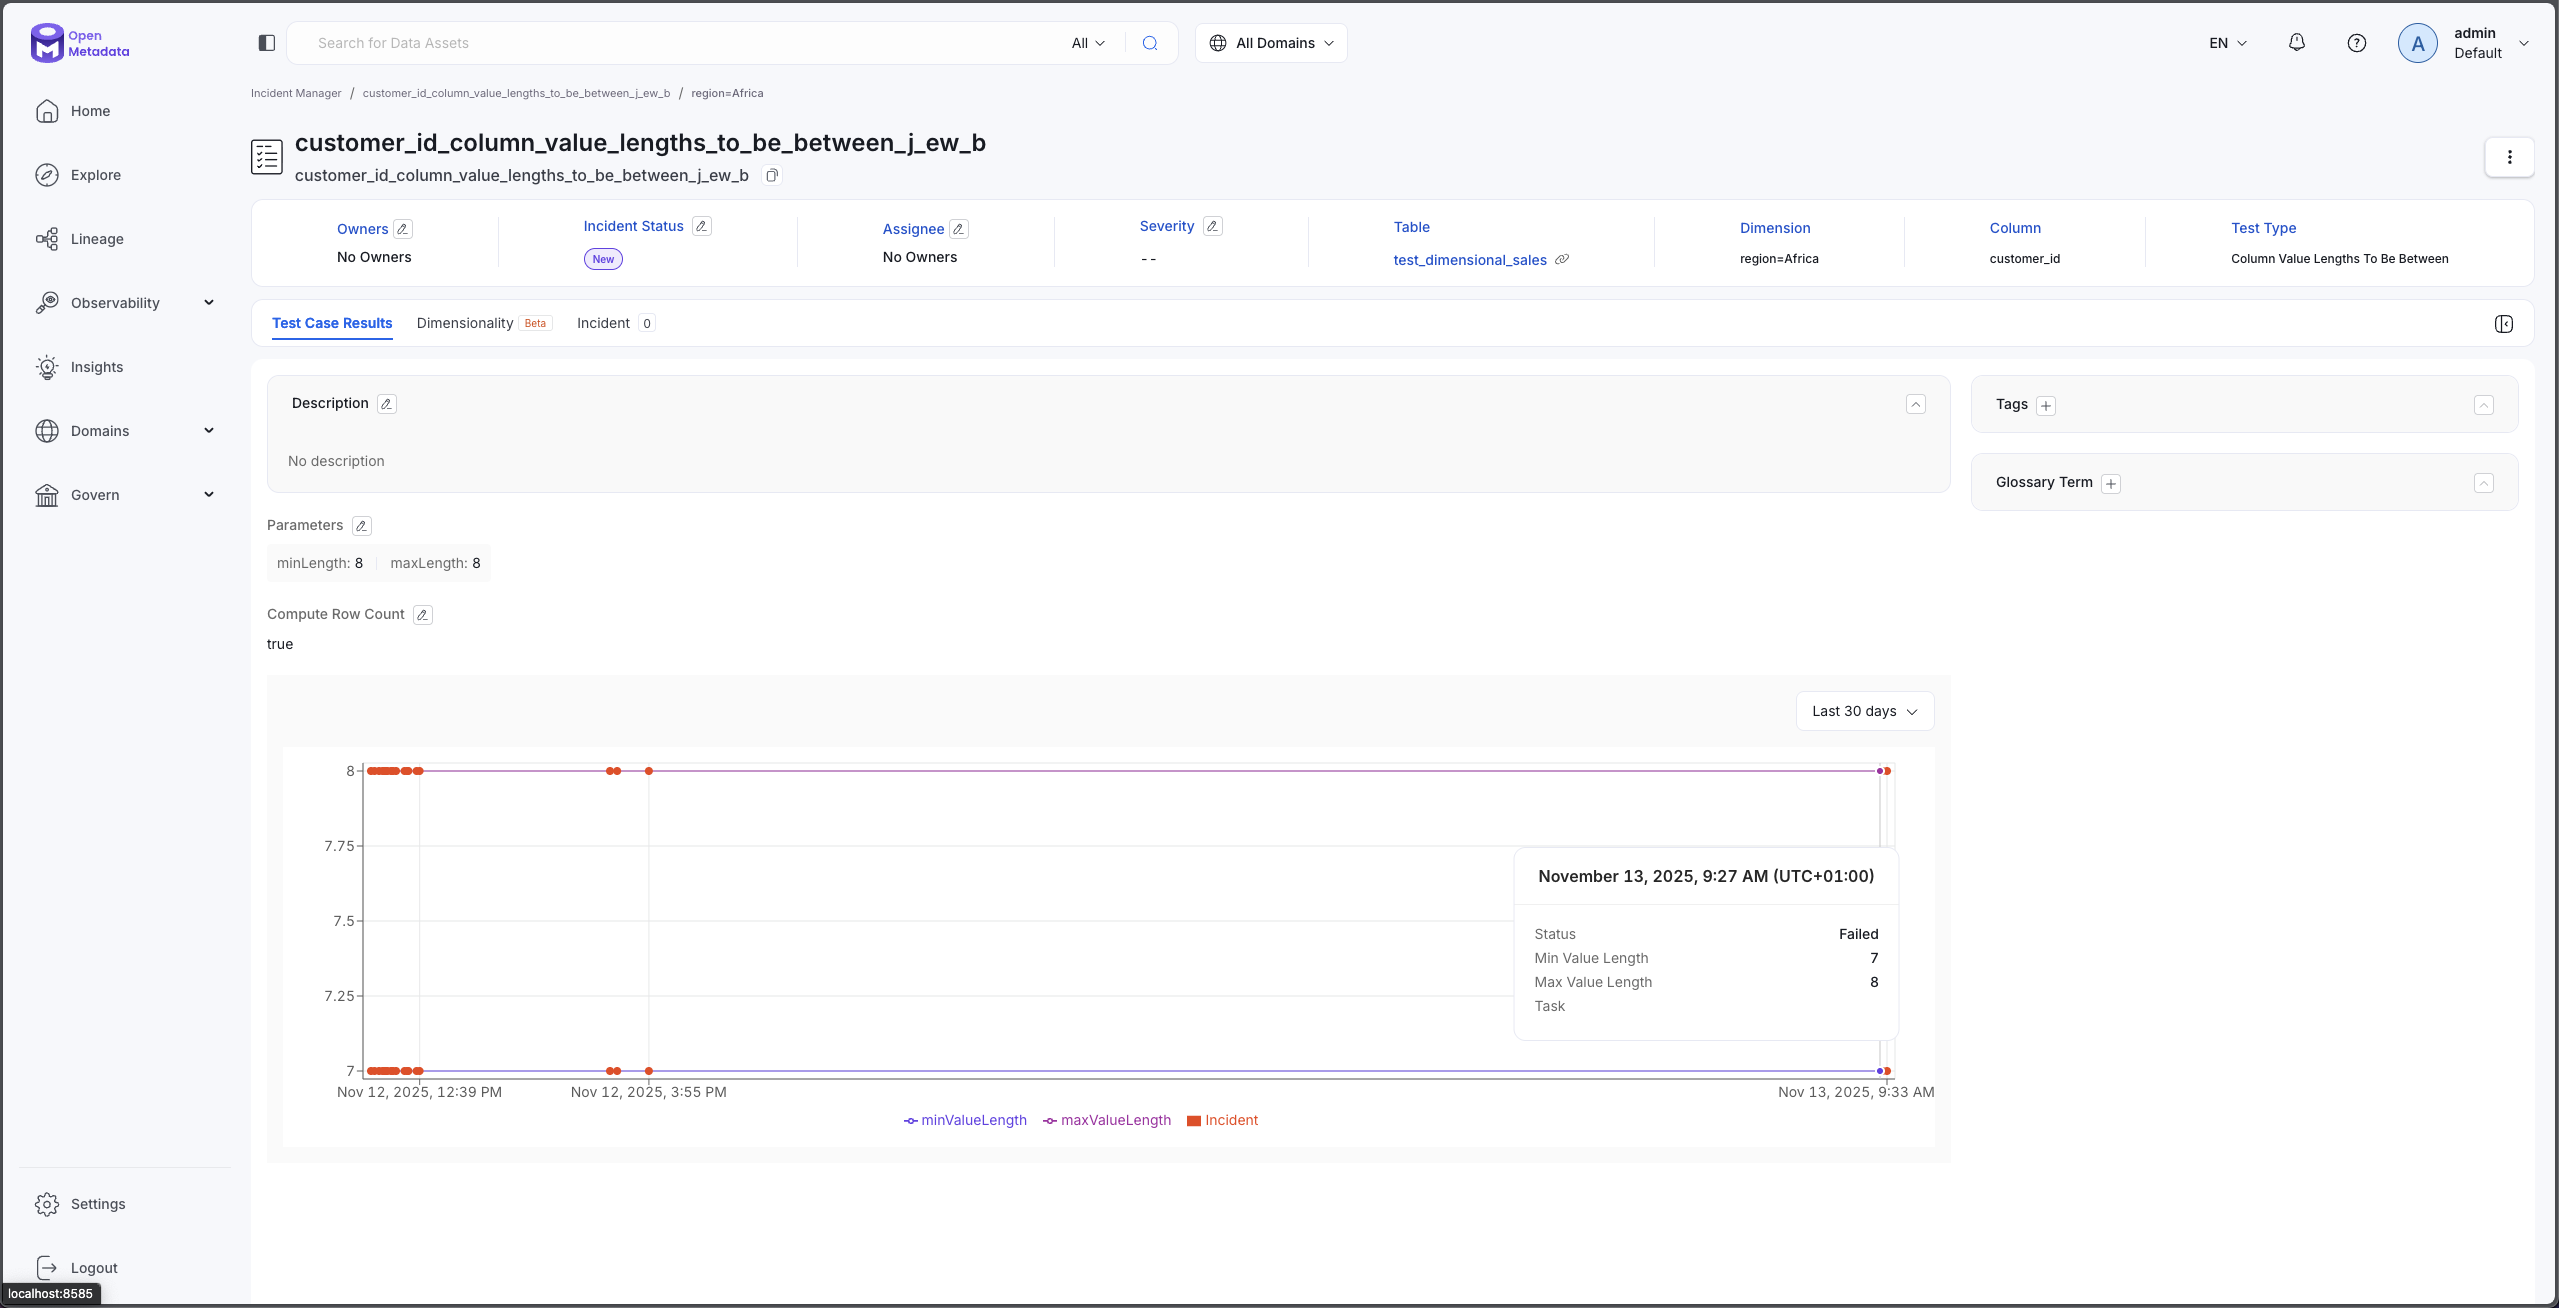
Track quality trends for each dimension over time
Best Practices
Follow these best practices to get the most value from dimensional validation while maintaining good performance.
Choose Meaningful Dimensions
Select dimension columns that provide actionable business insights:
✅ Good dimension choices:
- Geographic segments (region, country, state, store_location)
- Business categories (product_type, department, customer_segment)
- Operational groups (warehouse_id, processing_center, supplier_name)
- Time periods (order_month, fiscal_quarter, year)
❌ Poor dimension choices:
- High-cardinality IDs (customer_id, order_id, transaction_id)
- Free-text fields (comments, descriptions, addresses)
- Unique identifiers or timestamps
- Columns with mostly null values
Optimize Cardinality
If your desired dimension has high cardinality, consider:
- Grouping values: Convert specific cities into regions, or group dates into months
- Creating derived columns: Add a calculated column with grouped values (e.g.,
customer_tierderived fromcustomer_id)
Start Small, Then Scale
When implementing dimensional validation:
- Start with one or two critical tests on important tables
- Choose low-cardinality dimensions initially
- Validate performance before expanding to more tests
- Add sampling if execution time exceeds acceptable limits
- Gradually expand to additional tables and dimensions
Combine with Sampling for Large Tables
For large tables, enable Profile Sample to reduce data scan volumes For detailed sampling configuration, see Profiler Workflow - Profile Sample.
Use Partitioning
For large tables with partitioning columns, enable partitioning to focus tests on meaningful data For detailed partitioning configuration, see Profiler Workflow - Enable Partition.
Monitor Test Execution Time
Keep an eye on how long dimensional tests take to run:
- Baseline tests should complete in seconds to minutes
- Dimensional tests will take longer than non-dimensional tests. This varies greatly depending on the test type.
You can view execution times in the Pipeline tab after each test run.
Name Tests Clearly
Use descriptive test names that include the dimension:
- ✅
Email Completeness by Region - ✅
Price Range Validation by Product Category - ✅
Order Amount Accuracy per Warehouse - ❌
Test 1 - ❌
Column Check
Clear naming helps your team understand what each test validates and which dimensions it covers.
Document Business Context
In the test description field, explain:
- Why this dimension matters: What business decisions depend on this segmentation?
- Expected patterns: Are some dimensions expected to have different quality levels?
- Action owners: Who should be notified if this dimension fails?
Good documentation ensures your team can act on test failures effectively.
Real-World Examples
Here are practical examples showing how organizations use dimensional validation to solve real data quality challenges.
Example 1: E-Commerce Product Data Quality
Scenario: An e-commerce company wants to ensure product descriptions are complete across all categories.
Setup:
- Table:
product_catalog - Column:
product_description - Test Type: Column Values to be Not Null
- Dimension:
product_category
Results:
- Electronics: 98% complete (excellent)
- Clothing: 72% complete (needs attention)
- Home & Garden: 89% complete (good)
- Sports: 94% complete (good)
Action: The content team discovers that clothing descriptions are frequently missing. They prioritize improving clothing product content and implement stricter submission requirements for that category.
Example 2: Multi-Region Customer Email Validation
Scenario: A global SaaS company needs to validate email formats across different regional databases.
Setup:
- Table:
customers - Column:
email_address - Test Type: Column Values to Match Regex Pattern
- Pattern:
^[a-zA-Z0-9._%+-]+@[a-zA-Z0-9.-]+\.[a-zA-Z]{2,}$ - Dimension:
registration_region
Results:
- North America: 99.8% valid
- Europe: 99.5% valid
- Asia Pacific: 96.2% valid (needs attention)
- Latin America: 99.1% valid
Action: Investigation reveals that the Asia Pacific region's customer portal has a validation bug allowing malformed emails. The engineering team fixes the bug and implements a data cleanup script.
Example 3: Financial Transaction Amount Monitoring
Scenario: A financial services company wants to ensure transaction amounts fall within expected ranges across different account types.
Setup:
- Table:
transactions - Column:
transaction_amount - Test Type: Column Values to be Between
- Range: $0.01 to $10,000
- Dimension:
account_type
Results:
- Checking: 99.9% valid
- Savings: 99.8% valid
- Business: 94.3% valid (needs attention)
- Credit: 99.5% valid
Action: The compliance team discovers that business accounts have more out-of-range transactions due to recent limit changes. They update account limits and implement additional monitoring for business accounts.
Limitations
Understanding current limitations helps you plan effective dimensional validation strategies.
High Cardinality Performance Impact
Issue: Dimensions with many unique values cause significant performance overhead.
Impact: Tests may take 5-10x longer to execute compared to baseline tests.
Workaround:
- Use sampling to reduce scan volume (10-50% samples)
- Create derived columns with grouped values
"Others" Group Limitations
Issue: The "Others" group combines all dimensions outside the top 10, which can hide specific problem areas.
Impact: You may not see individual quality issues for dimensions ranked 11th or lower.
Workaround:
- Reduce total dimension cardinality so all important values appear in top 10
Troubleshooting
My test returns "No results"
Possible causes:
- The test hasn't run yet—check the Pipeline tab to schedule execution
- Partitioning filtered out all data—verify partition configuration includes relevant dates
- Sampling excluded all dimension groups—increase sample percentage
Solution: Verify the test has executed at least once, and check partition/sample settings.
Dimensional results show "NULL" as a dimension value
Expected behavior: Null values in the dimension column are grouped together as a "NULL" dimension group.
If unexpected: Review your dimension column data quality—you may need to clean up null values in the dimension column before using it for segmentation.
Test execution takes too long
Cause: High cardinality dimension or large table without sampling/partitioning.
Solutions:
- Enable sampling
- Enable partitioning to test only recent data
- Choose a different dimension with lower cardinality