Requirements
OpenMetadata 1.1.1 or later
To deploy OpenMetadata, check the Deployment guides.
Metadata Ingestion
Connection Details
Connection Details
- Qlik Sense Base URL: This field refers to the base url of your Qlik Sense Portal, will be used for generating the redirect links for dashboards and charts. Example:
https://server.domain.comorhttps://server.domain.com/<proxy-path> - Qlik Engine JSON API Websocket URL: Enter the websocket url of Qlik Sense Engine JSON API. Refer to this document for more details about. Example:
wss://server.domain.com:4747orwss://server.domain.com[/virtual proxy]. Since we use the Qlik Sense Engine APIs, we need to authenticate to those APIs using certificates generated on Qlik Management Console. Qlik Certificate By Values: In this approach we provide the content of the certificates to the relevant field. - Client Certificate Value: This field specifies the value of
client.pemcertificate required for authentication. - Client Key Certificate Value: This field specifies the value of
client_key.pemcertificate required for authentication. - Root Certificate Value: This field specifies the value of
root.pemcertificate required for authentication. - Staging Directory Path: This field specifies the path to temporary staging directory, where the certificates will be stored temporarily during the ingestion process, which will de deleted once the ingestion job is over. when you are using this approach make sure you are passing the key in a correct format. If your certificate looks like this:
\n and the final private key that you need to pass should look like this:- Client Certificate Path: This field specifies the path of
client.pemcertificate required for authentication. - Client Key Certificate Value: This field specifies the path of
client_key.pemcertificate required for authentication. - Root Certificate Value: This field specifies the path of
root.pemcertificate required for authentication. User Directory: This field specifies the user directory of the user. User ID: This field specifies the user id of the user. Validate Host Name: Enable/Disable this field to validate the host name against the provided certificates.
Test the Connection
Once the credentials have been added, click on Test Connection and Save the changes.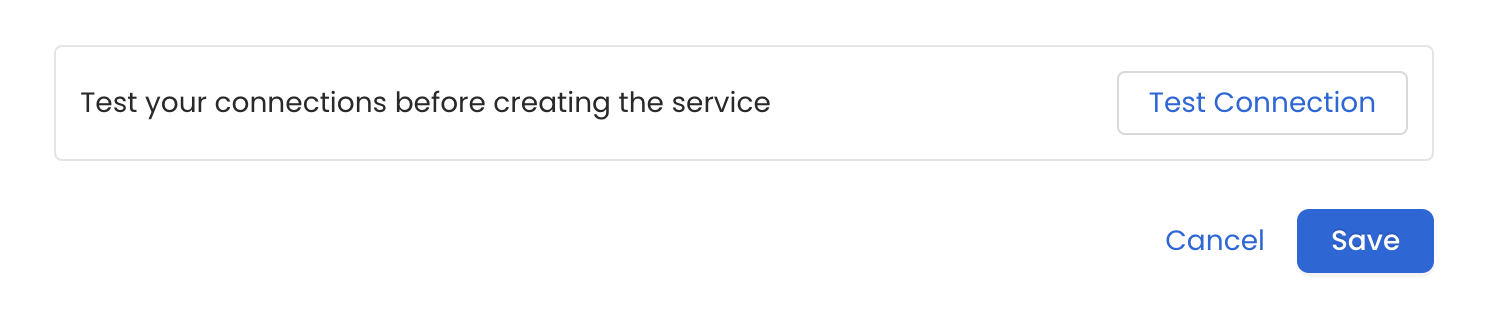
Configure Metadata Ingestion
After adding and testing the dashboard service, configure the metadata ingestion pipeline. To configure, follow the steps below: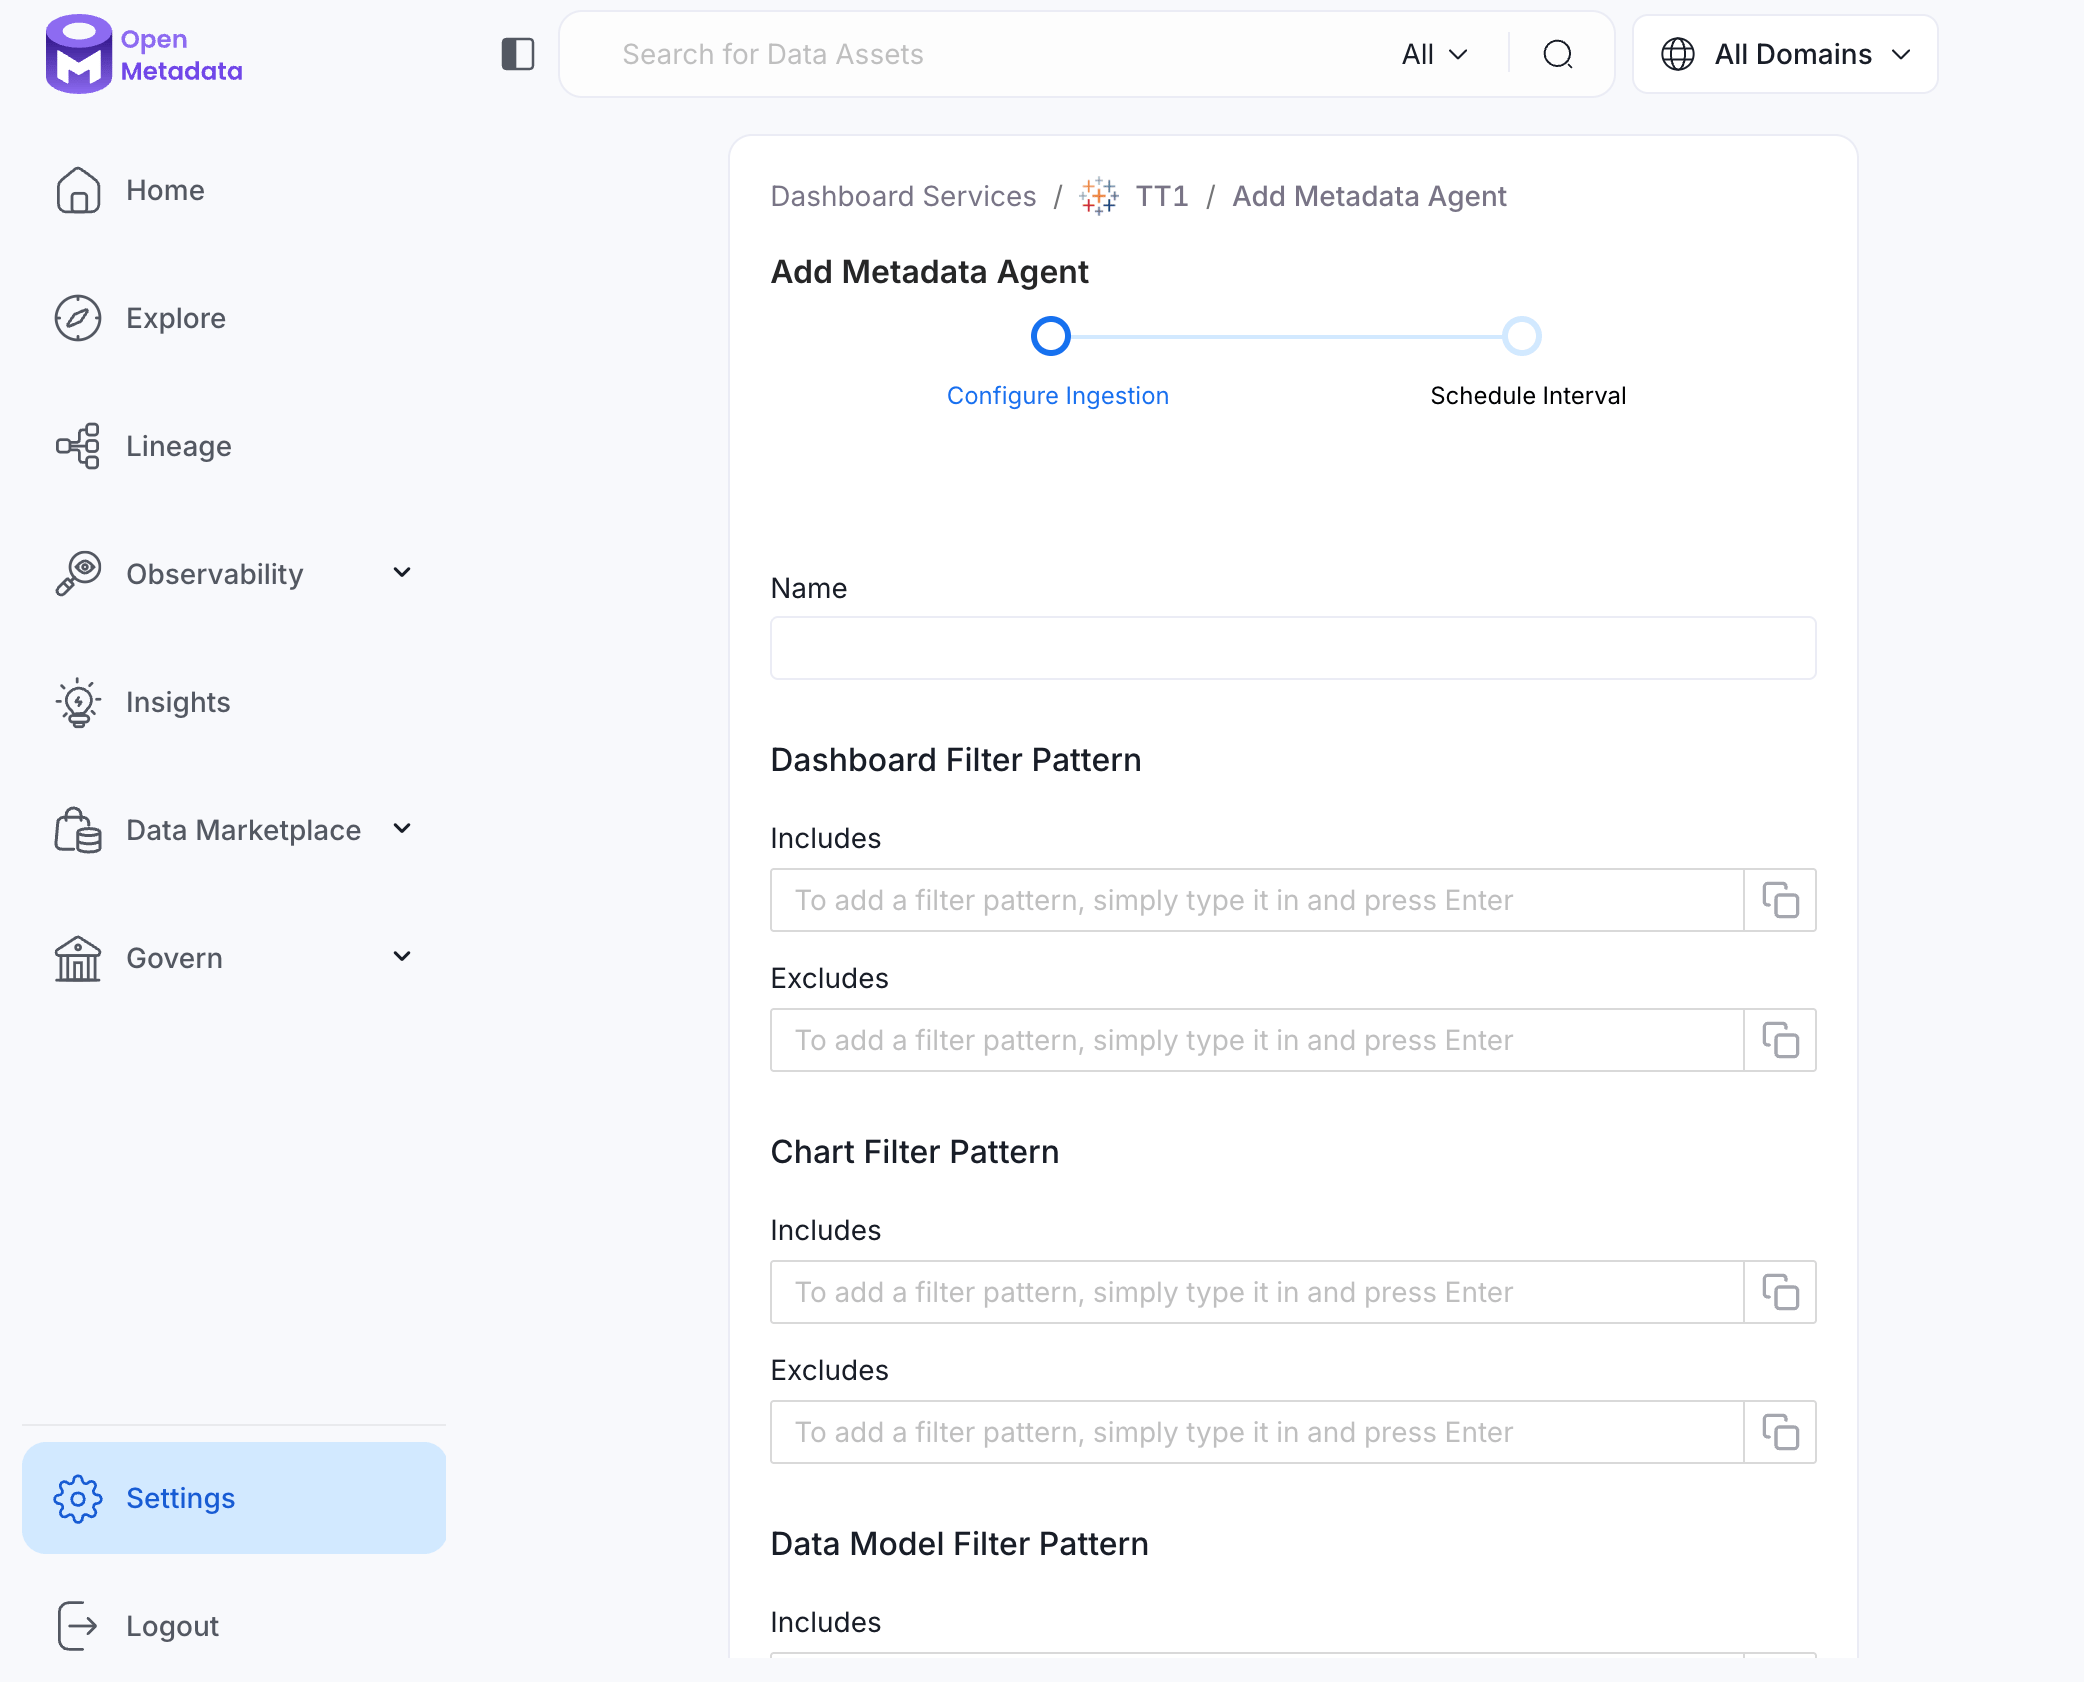
- Navigate to Settings > Services > Dashboards.
- On the Dashboards services page, click the service you’ve added.
- Go to the Agents tab, and then click Add Agent > Add Metadata Agent.
- Configure the ingestion details. See Metadata Ingestion Options.
Metadata Ingestion Options
- Name: This field is the name of the ingestion pipeline. Customize it or use the generated name.
- Dashboard Filter Pattern (Optional): Use it to control whether to include dashboards as part of metadata ingestion.
- Include: Explicitly include dashboards by adding comma-separated regular expressions to the ‘Include’ field. OpenMetadata will include all dashboards with names matching one or more of the supplied regular expressions. All other dashboards will be excluded.
- Exclude: Explicitly exclude dashboards by adding comma-separated regular expressions to the ‘Exclude’ field. OpenMetadata will exclude all dashboards with names matching one or more of the supplied regular expressions. All other dashboards will be included.
- Chart Filter Pattern (Optional): Use it to control whether to include charts as part of metadata ingestion.
- Include: Explicitly include charts by adding comma-separated regular expressions to the ‘Include’ field. OpenMetadata will include all charts with names matching one or more of the supplied regular expressions. All other charts will be excluded.
- Exclude: Explicitly exclude charts by adding comma-separated regular expressions to the ‘Exclude’ field. OpenMetadata will exclude all charts with names matching one or more of the supplied regular expressions. All other charts will be included.
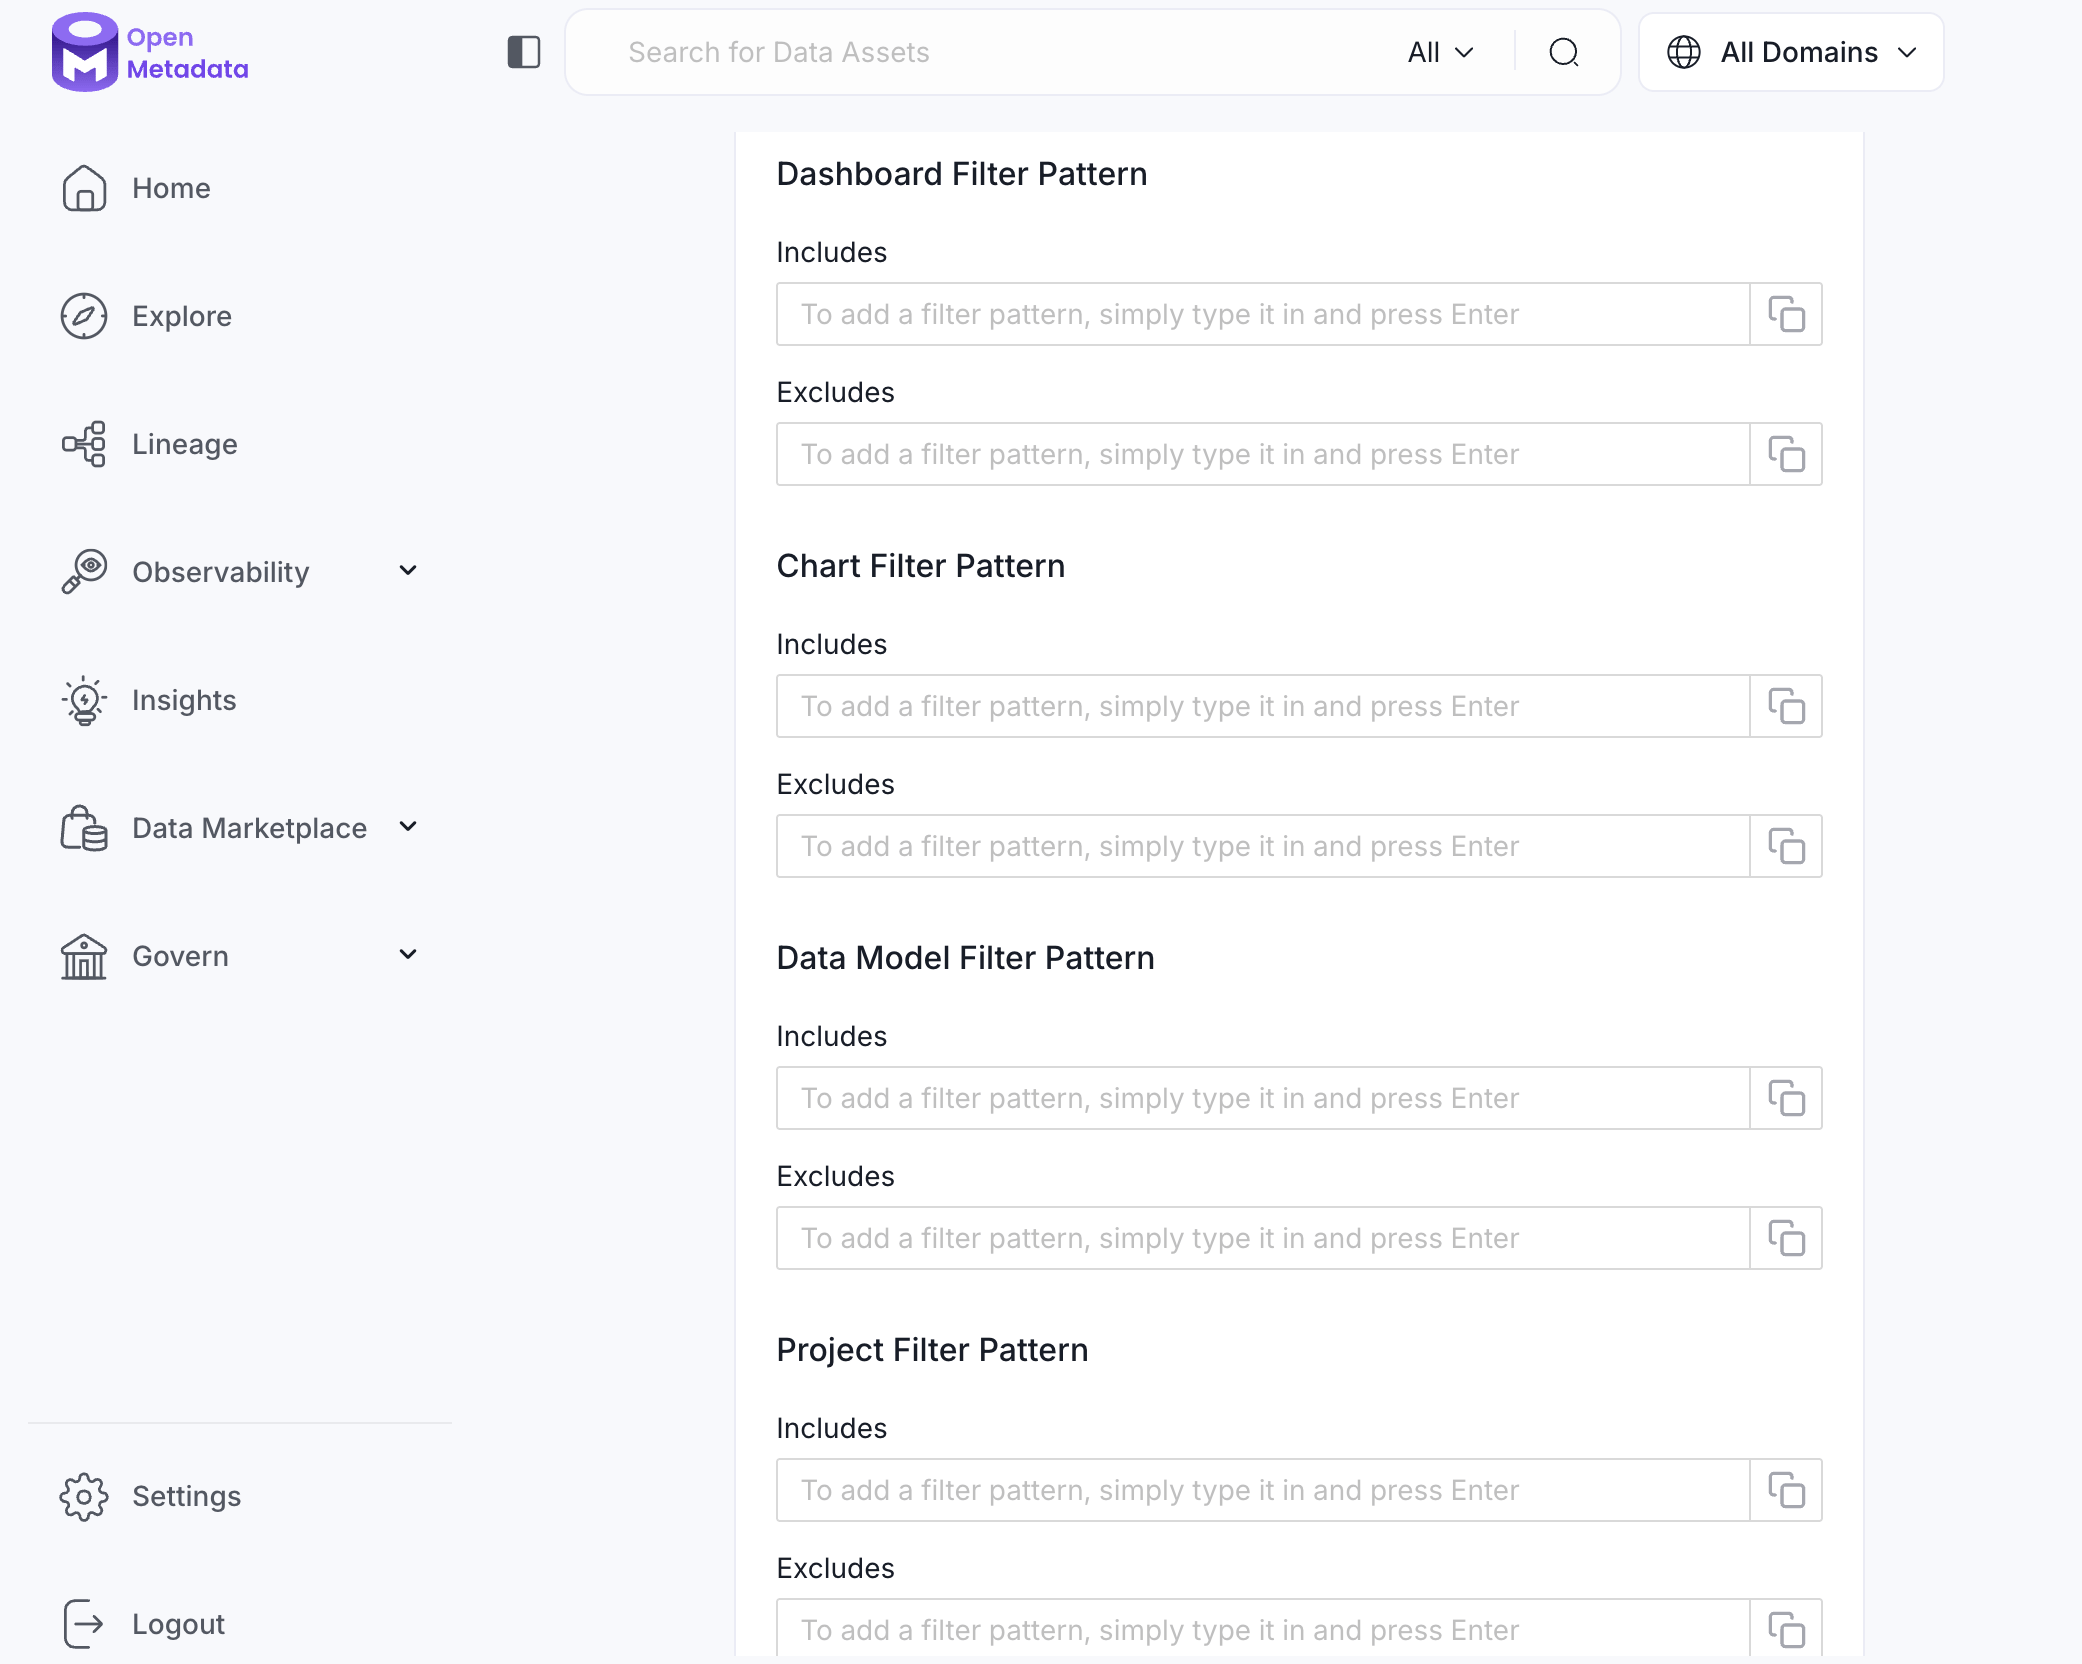
- Data Model Filter Pattern (Optional): Use it to control whether to include data models as part of metadata ingestion.
- Include: Explicitly include data models by adding comma-separated regular expressions to the ‘Include’ field. OpenMetadata will include all data models with names matching one or more of the supplied regular expressions. All other data models will be excluded.
- Exclude: Explicitly exclude data models by adding comma-separated regular expressions to the ‘Exclude’ field. OpenMetadata will exclude all data models with names matching one or more of the supplied regular expressions. All other data models will be included.
- Project Filter Pattern: Filter the dashboards, charts, and data sources by projects. Note that all of them support regex as include or exclude. For example, “My project, My proj.*, .*Project”.
- Enable Debug Log: Enable this toggle to use debug-level logging.
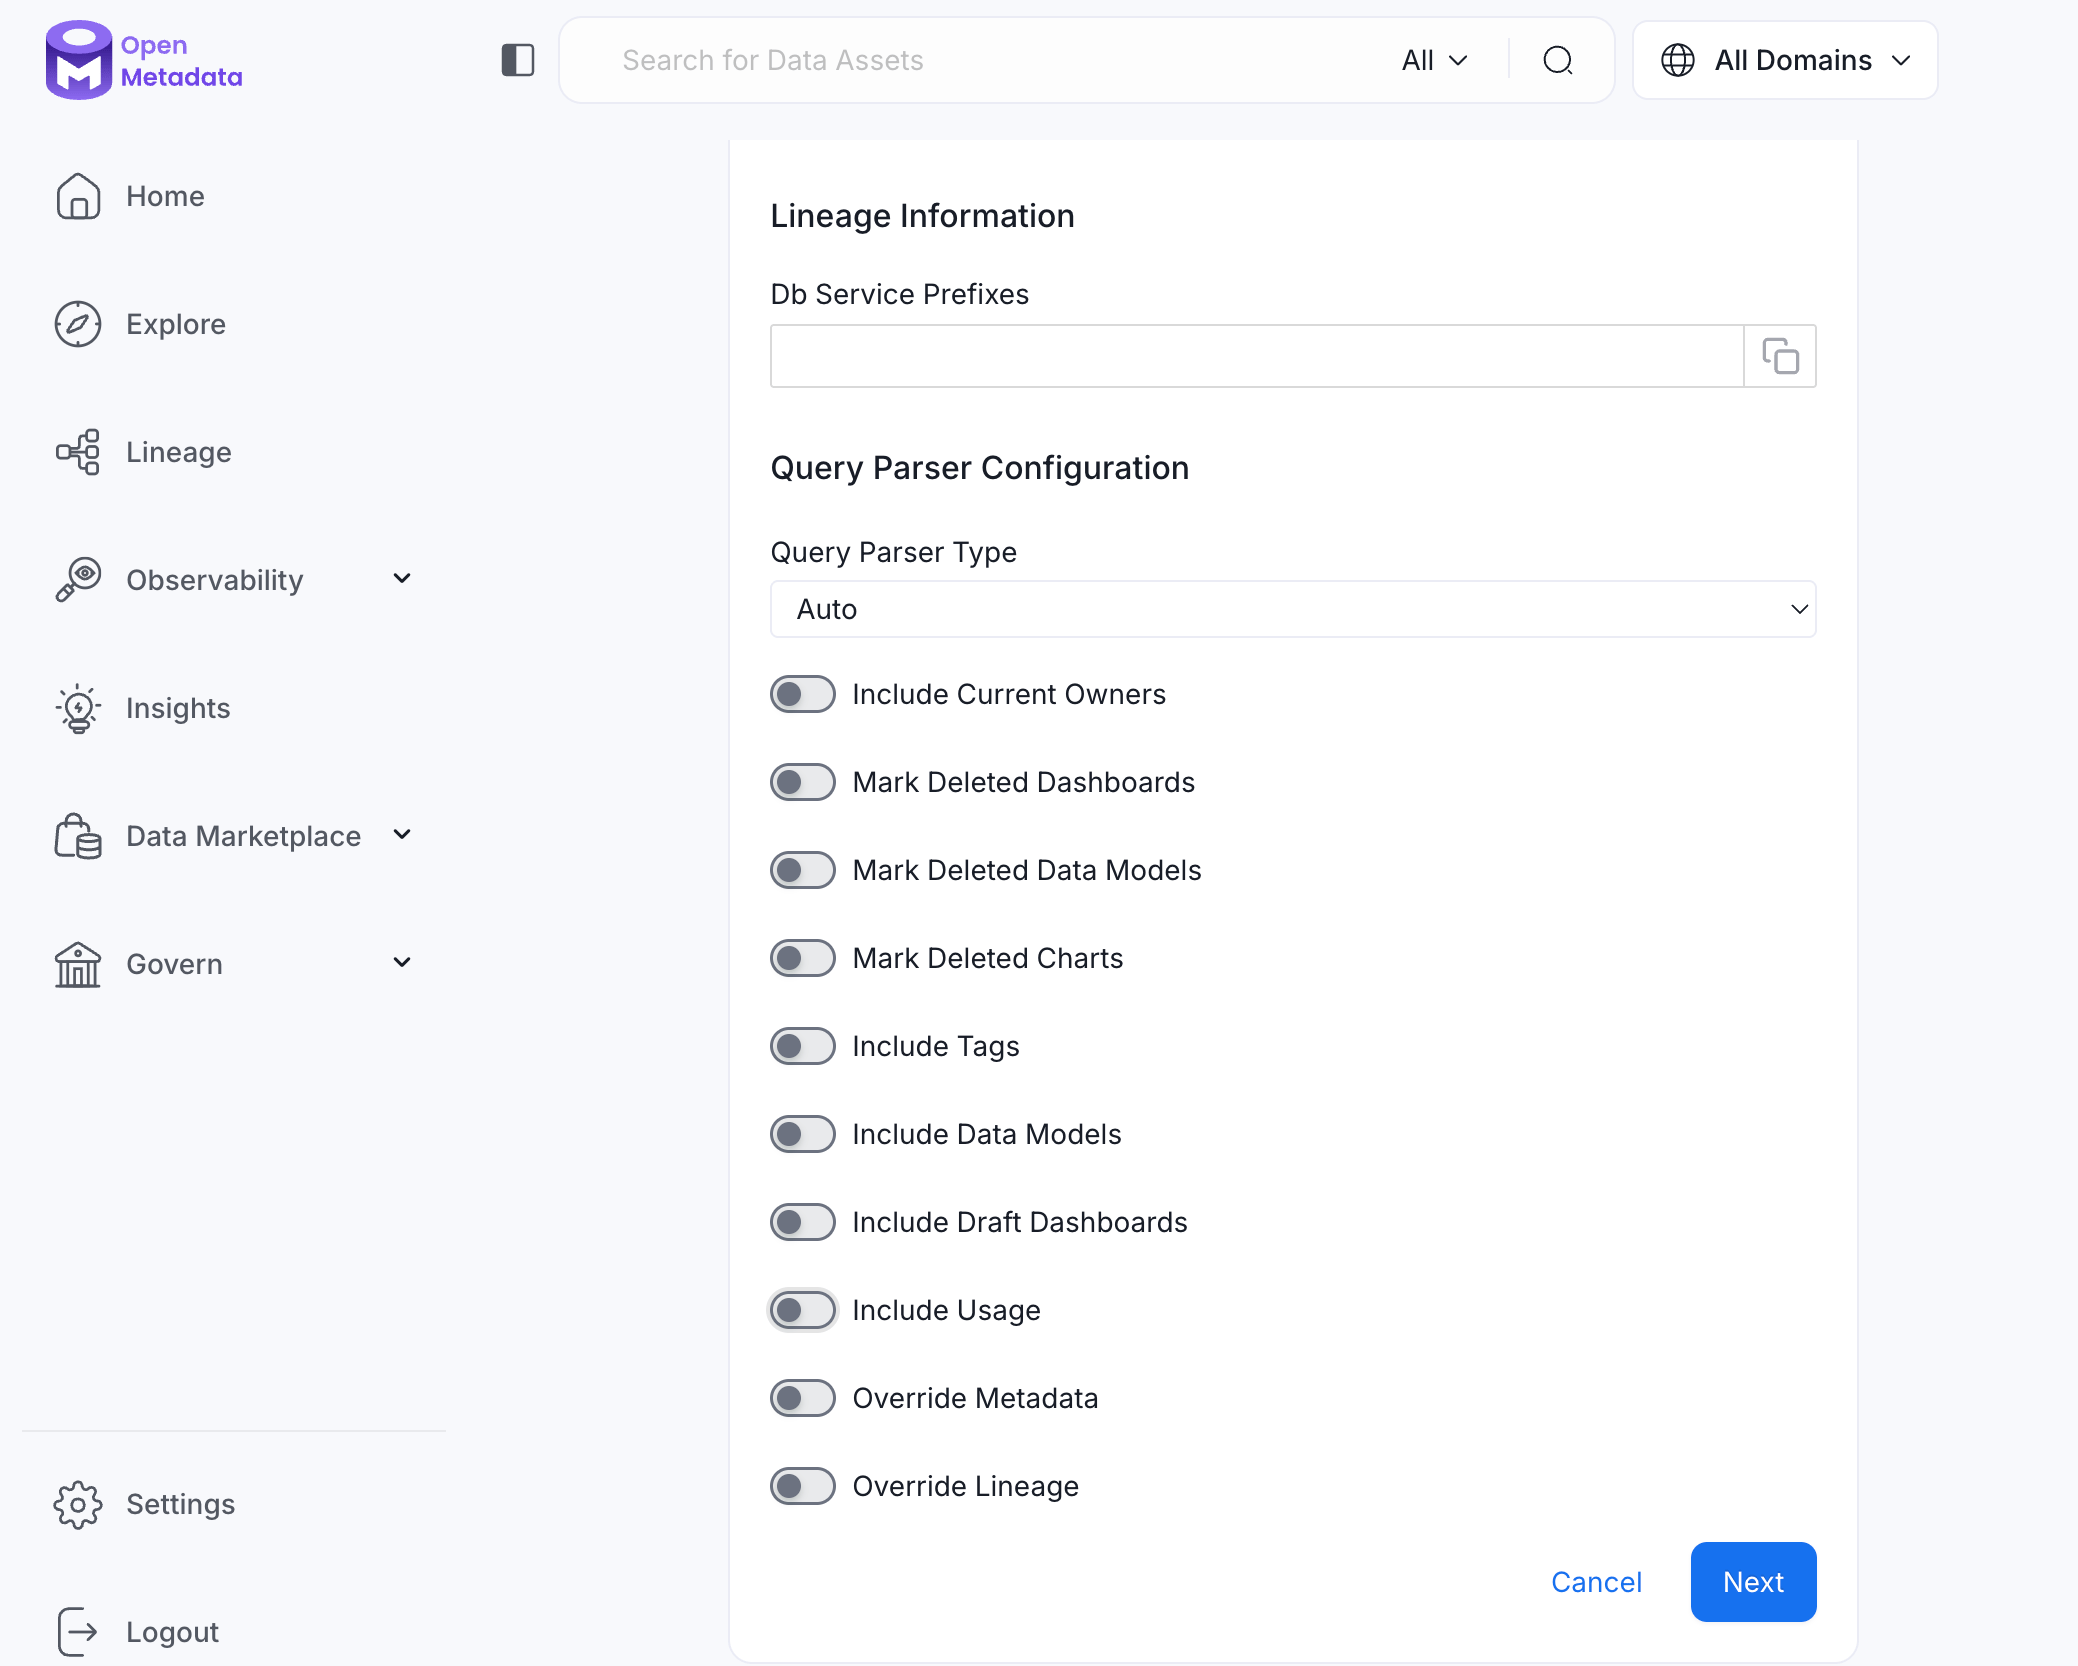
- Lineage Information (Optional): Configure this section to enable lineage between your dashboards and the database tables they are built on. OpenMetadata uses the database service name to match and draw the lineage path from table to dashboard.
- Db Service Prefixes: Enter one or more service path prefixes to tell OpenMetadata where to look for the source tables used by your dashboards. Supported formats:
DBServiceName—matches all tables in the serviceDBServiceName.DatabaseName—matches tables in a specific databaseDBServiceName.DatabaseName.SchemaName—matches tables in a specific schemaDBServiceName.DatabaseName.SchemaName.TableName—matches a specific table
- Db Service Prefixes: Enter one or more service path prefixes to tell OpenMetadata where to look for the source tables used by your dashboards. Supported formats:
- Query Parser Configuration: Controls how OpenMetadata parses SQL queries to extract lineage. Use this to select the SQL parser that best fits your data source’s dialect.
- Query Parser Type: Choose the SQL parser for lineage extraction:
- Auto (default): Automatically tries SqlGlot first, falls back to SqlFluff, then SqlParse. Recommended for best results.
- SqlGlot: High-performance parser with good dialect support. Falls back to SqlParse on failure.
- SqlFluff: Comprehensive but slower parser with strong dialect support. Falls back to SqlParse on failure.
- Query Parser Type: Choose the SQL parser for lineage extraction:
- Include Current Owners: Enable this toggle to control whether to include owners for the ingested entity if the owner email matches a user stored in the OpenMetadata server as part of metadata ingestion. If the ingested entity already exists and has an owner, the owner will not be overwritten.
- Mark Deleted Dashboards: Optional configuration to soft delete dashboards in OpenMetadata if the source dashboards are deleted. After deleting, all associated entities like lineage and other related data for that dashboard will be deleted.
- Mark Deleted Data Models: Optional configuration to soft delete data models in OpenMetadata if the source data models are deleted. After deleting, all associated entities with that data model will be deleted.
- Mark Deleted Charts: Optional configuration to soft delete charts in OpenMetadata if the source charts are deleted. After deleting, all associated entities with that chart will be deleted.
- Include Tags: Enable this toggle to control whether to include tags in metadata ingestion.
- Include Data Models: Enable this toggle to control whether to include data models as part of metadata ingestion.
- Include Draft Dashboard: Enable this toggle to include draft dashboards. By default, this is enabled.
- Include Usage: Enable this toggle to control whether to include usage data as part of metadata ingestion.
- Override Metadata: Enable this toggle to control whether to override the existing metadata in the OpenMetadata server with the metadata fetched from the source. If enabled, the metadata fetched from the source will override the existing metadata in OpenMetadata. If disabled, only fields that have no value in OpenMetadata will be updated. This is applicable for fields like description, tags, owner, and displayName.
- Override Lineage: Enable this toggle to control whether to override the existing lineage in OpenMetadata with the lineage fetched from the source. If enabled, existing lineage will be replaced. If disabled, new lineage edges will be added without removing existing ones.
Schedule the Ingestion and Deploy
Scheduling can be set up at an hourly, daily, weekly, or manual cadence. The
timezone is in UTC. Select a Start Date to schedule for ingestion. It is
optional to add an End Date.Review your configuration settings. If they match what you intended,
click Deploy to create the service and schedule metadata ingestion.If something doesn’t look right, click the Back button to return to the
appropriate step and change the settings as needed.After configuring the workflow, you can click on Deploy to create the
pipeline.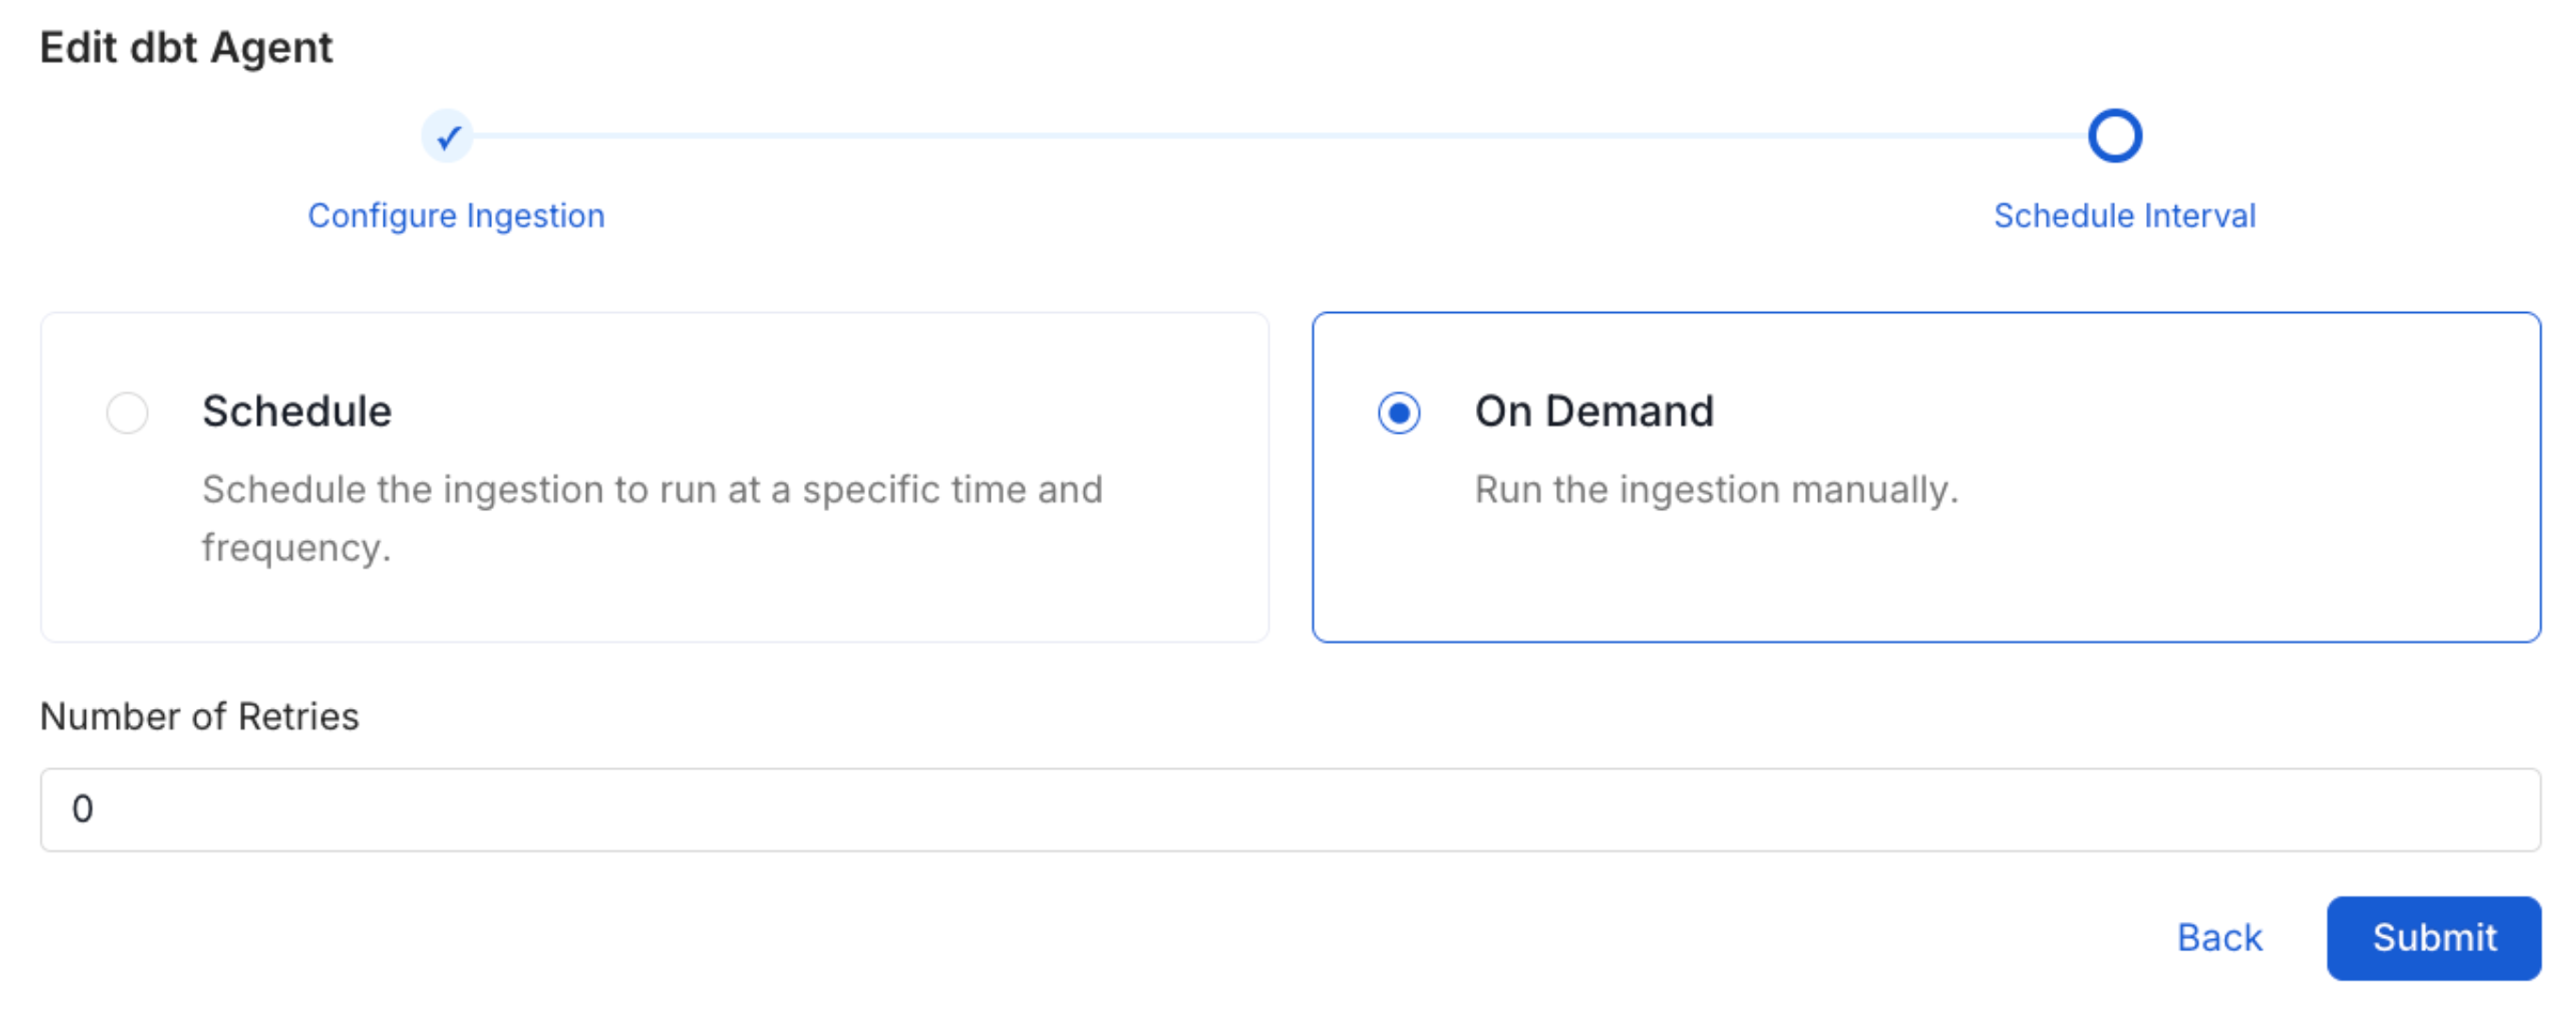
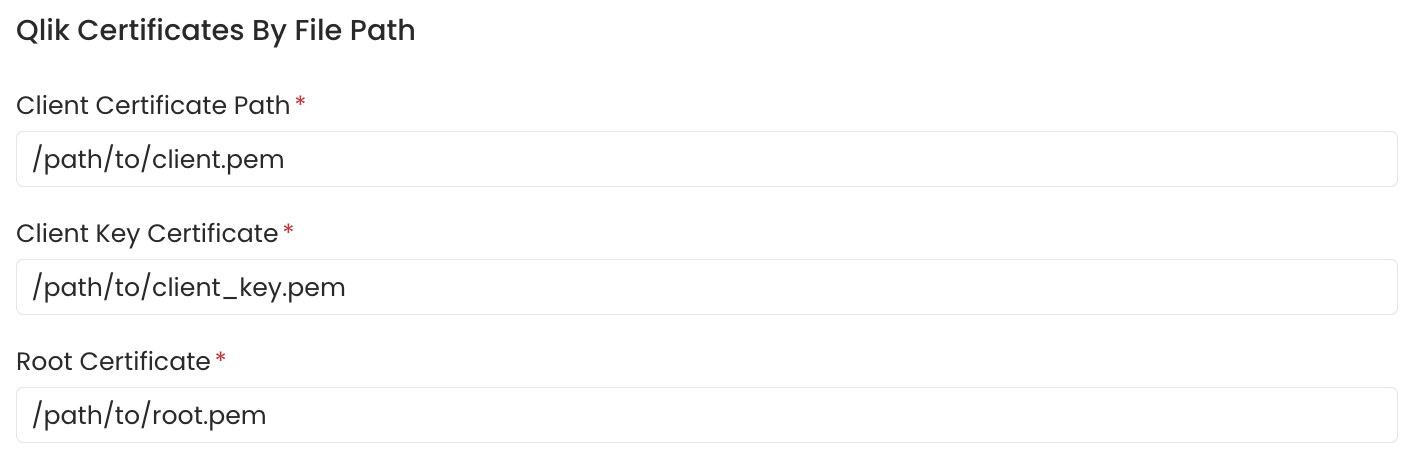
Securing Qlik Sense Connection with SSL in OpenMetadata
To establish secure connections between OpenMetadata and Qlik Sense, there are two ways to communicate: defining the certificate file path or using the certificates value. Navigate to theAdvanced Config section.
When using the local certificate file path, ensure that the certificates are accessible from the Airflow Server. You can specify the path for the client certificate, client key certificate, and root certificate.
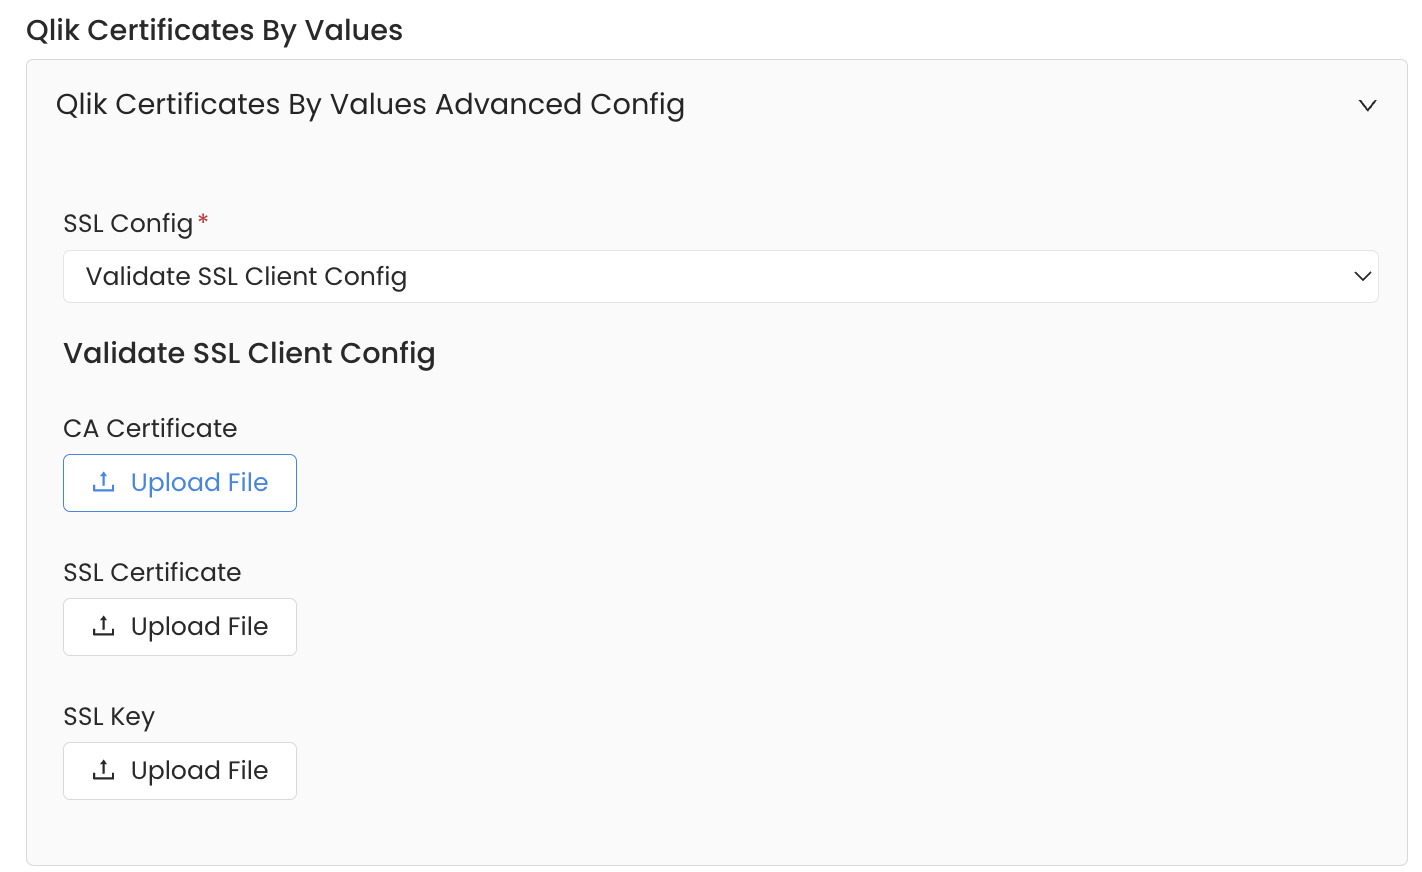
Alternatively, when using the certificates value, you can provide the CA certificate used for SSL validation by specifying the CA Certificate. If both client and server require mutual authentication, you can upload all three: CA Certificate, SSL Certificate, and SSL Key.
Refer to the guide on how to generate authentication certificates so that OpenMetadata can communicate with Qlik Sense here.
Lineage
Lineage in OpenMetadata shows you which database tables power each dashboard. When lineage is set up, you can trace any dashboard back to the exact source tables in your database. There is no separate lineage agent or lineage pipeline—lineage is collected as part of the same metadata ingestion workflow. Configuring the Db Service Prefixes field (covered below) is optional but recommended — it restricts table matching to specific database services. If left blank, OpenMetadata attempts to match source tables across all ingested database services.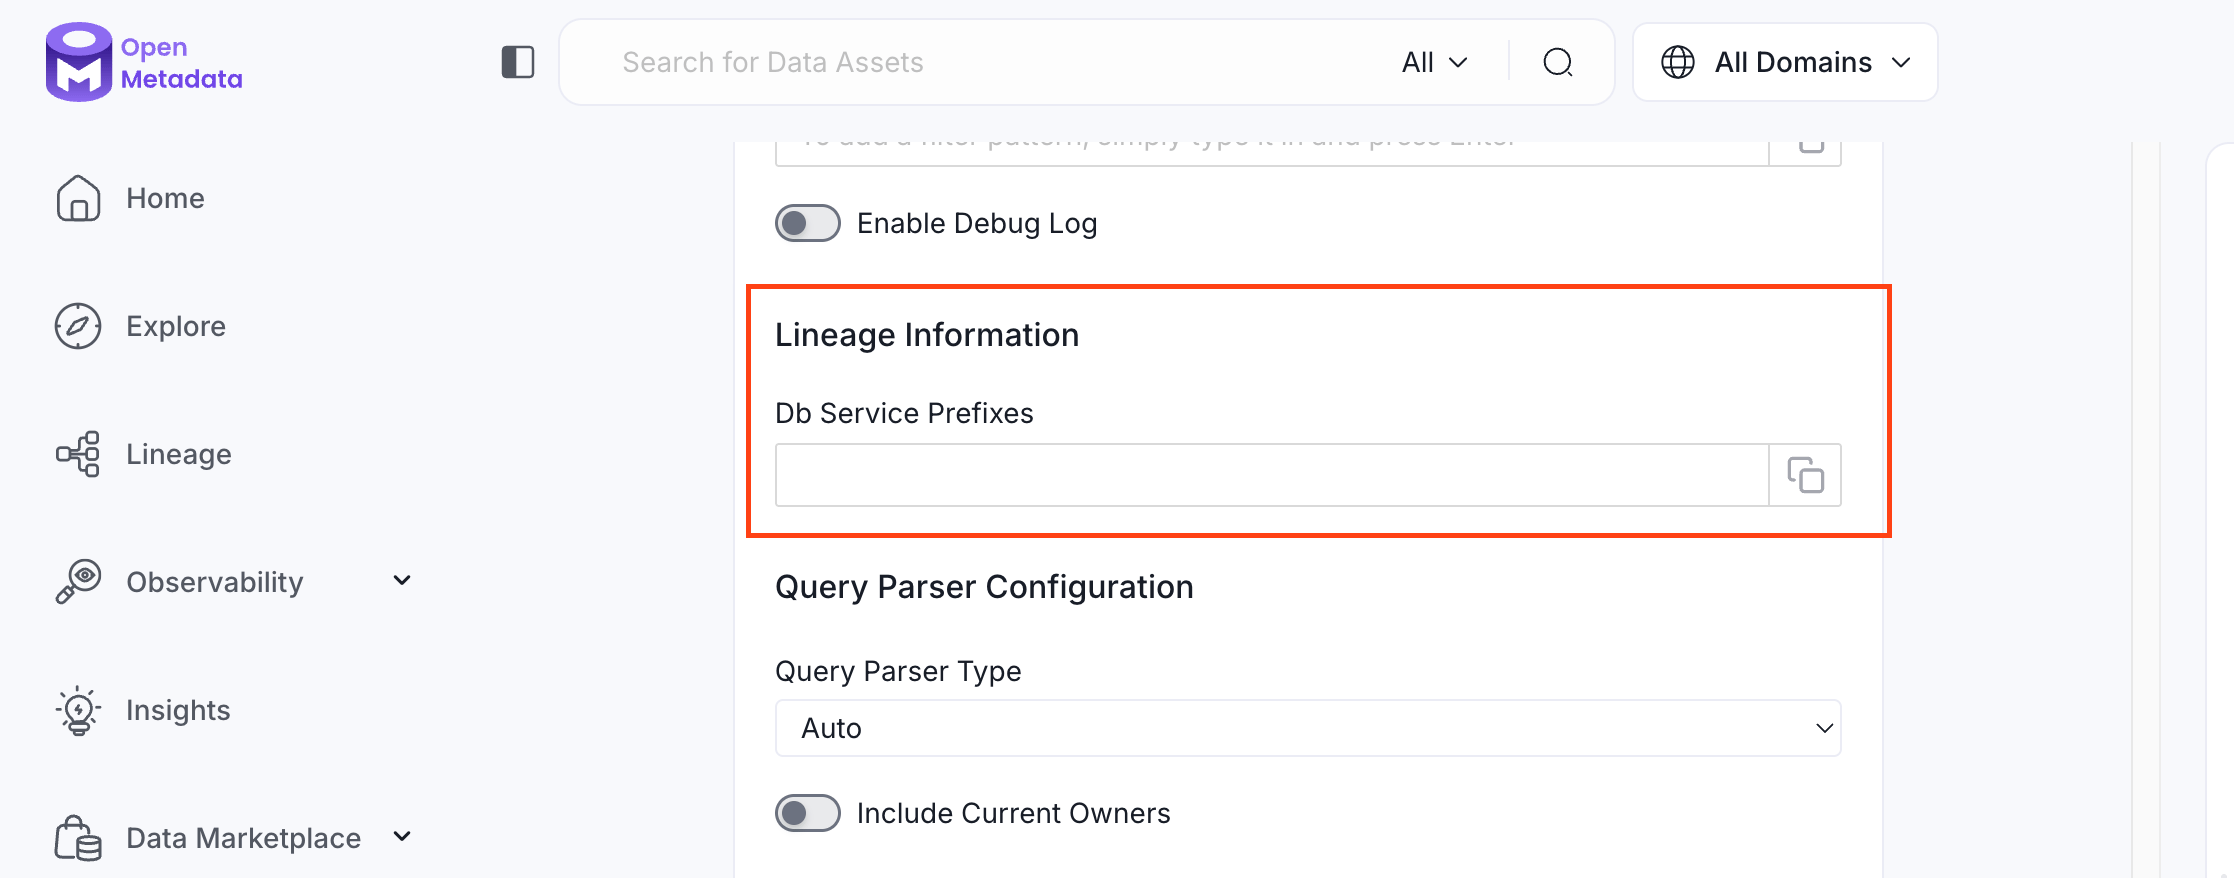
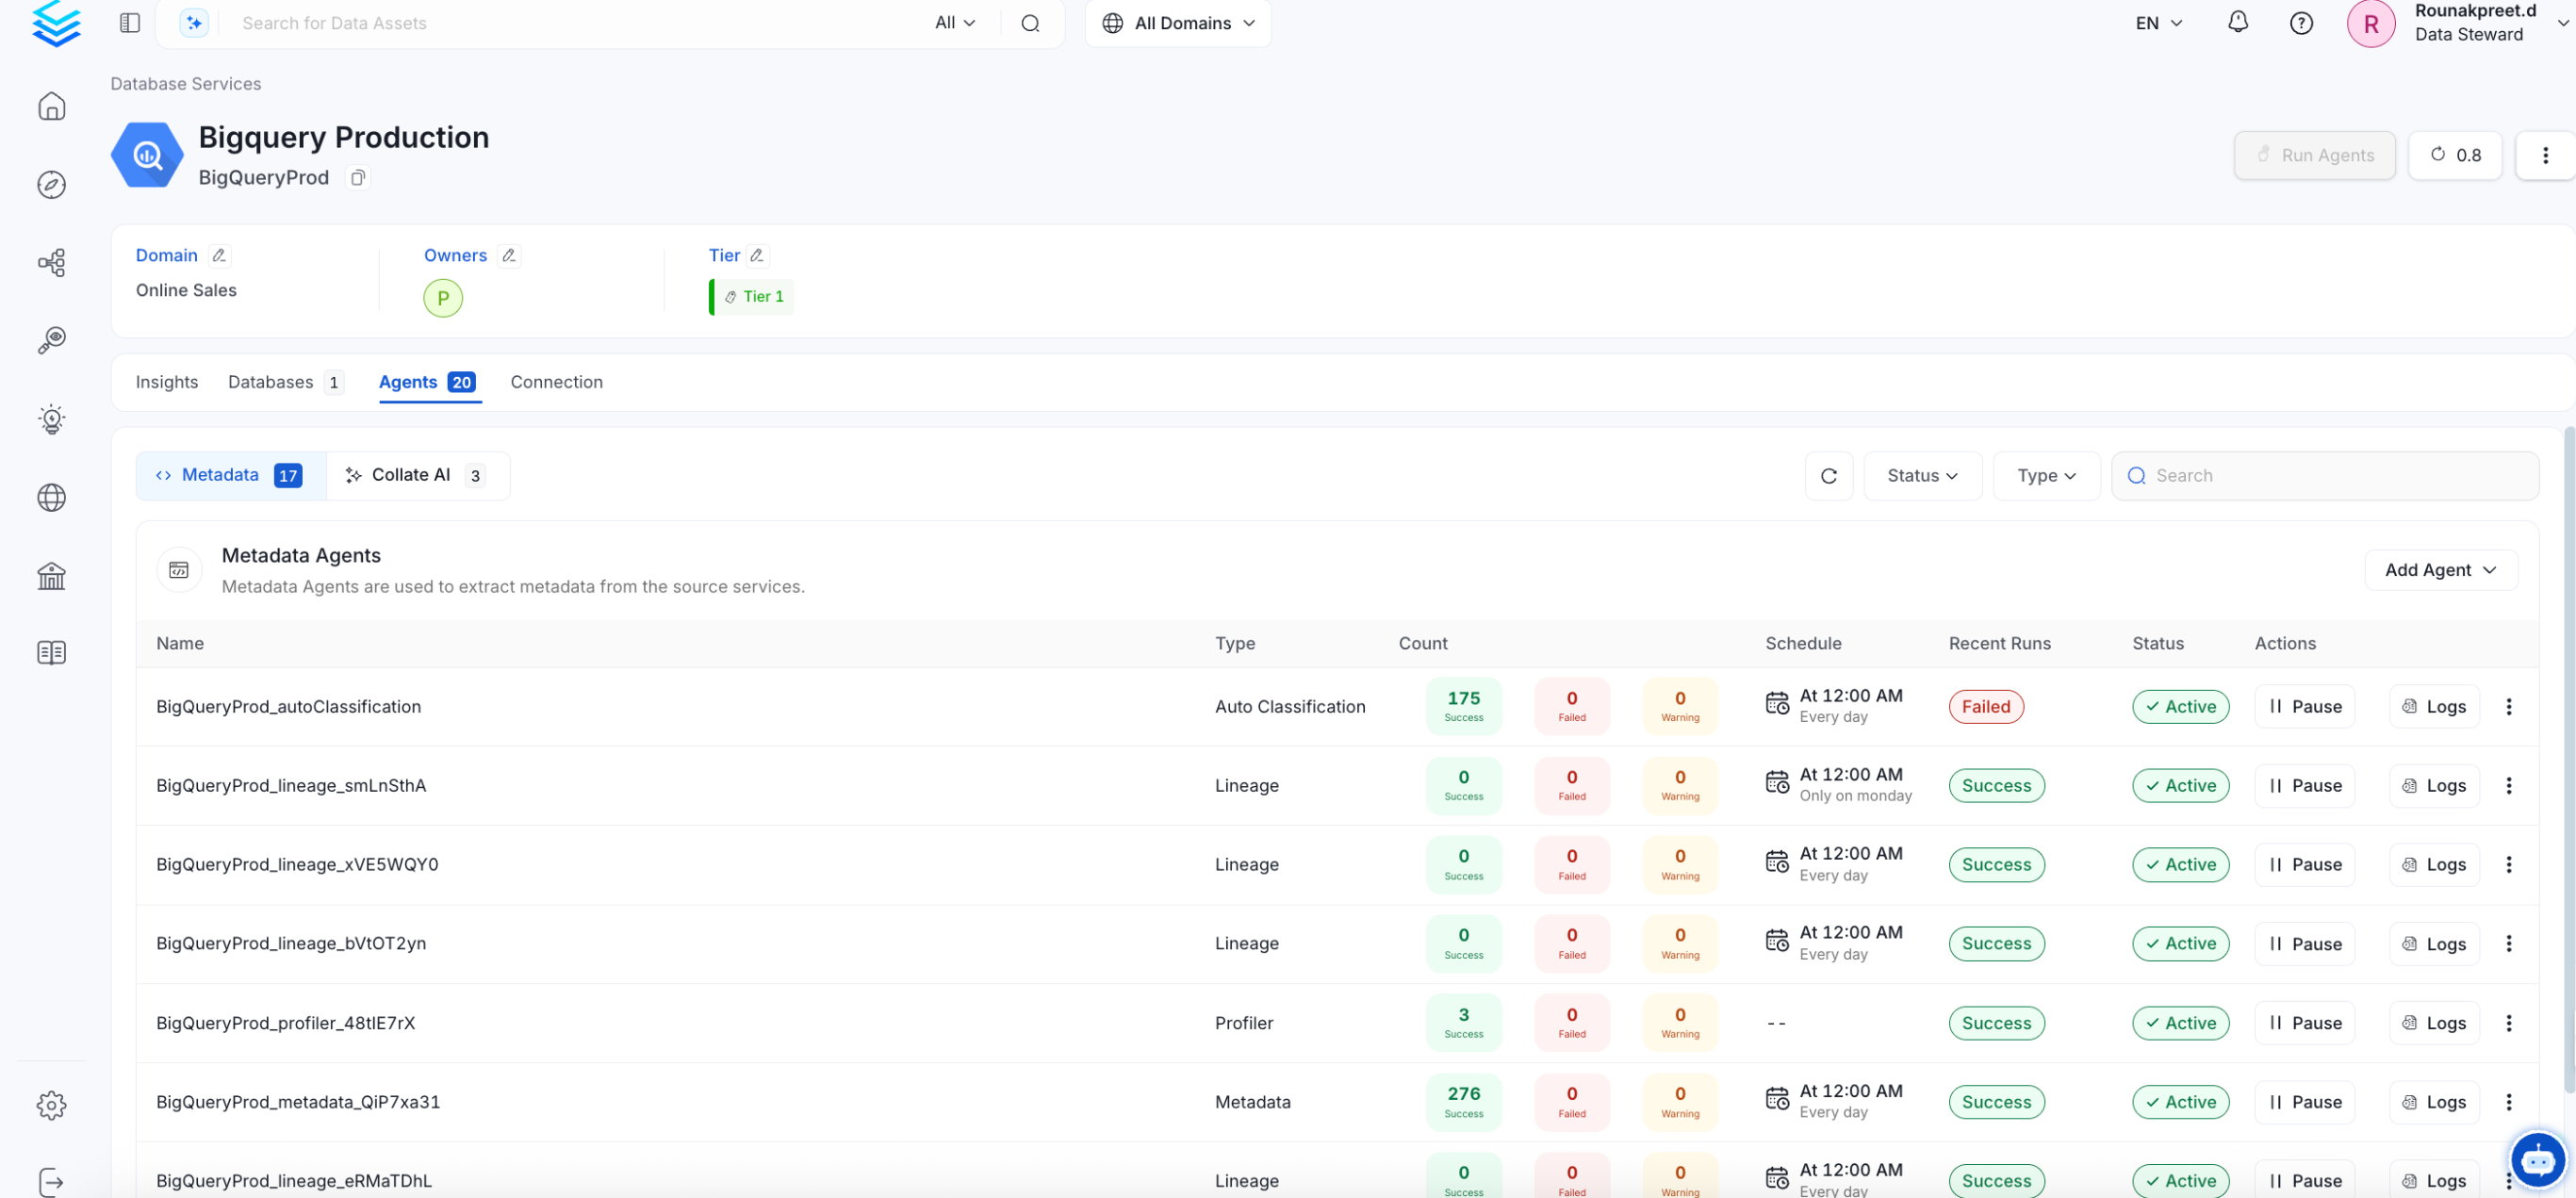
How to Set Up Lineage
- Go to Settings > Services > Dashboards.
- Click the dashboard service you’ve added.
- Go to the Agents tab, then select Add Agent > Add Metadata Agent. If a metadata agent already exists, select the three-dot context menu (⋮) next to it and select Edit.
- In the Configure Ingestion step, scroll down to the Lineage Information section.
- Optionally enter one or more database service names in the Db Service Prefixes field to restrict table matching to specific services. If left blank, OpenMetadata searches across all ingested database services.
| What you enter | What it matches |
|---|---|
SnowflakeProd | All tables in the Snowflake service named SnowflakeProd |
SnowflakeProd.sales_db | Tables in the sales_db database within SnowflakeProd |
SnowflakeProd.sales_db.public | Tables in the public schema within sales_db |