
Explore — View Mode
View mode is for reading the model: what concepts exist, how they connect, which ones are orphaned, and which real data assets each one covers. It works with the RDF triple store switched off. Two surfaces share the sub-mode bar: Graph and Tree.Graph
The graph canvas draws concepts as nodes grouped by their parent glossary, and typed relations as labeled, color-coded edges.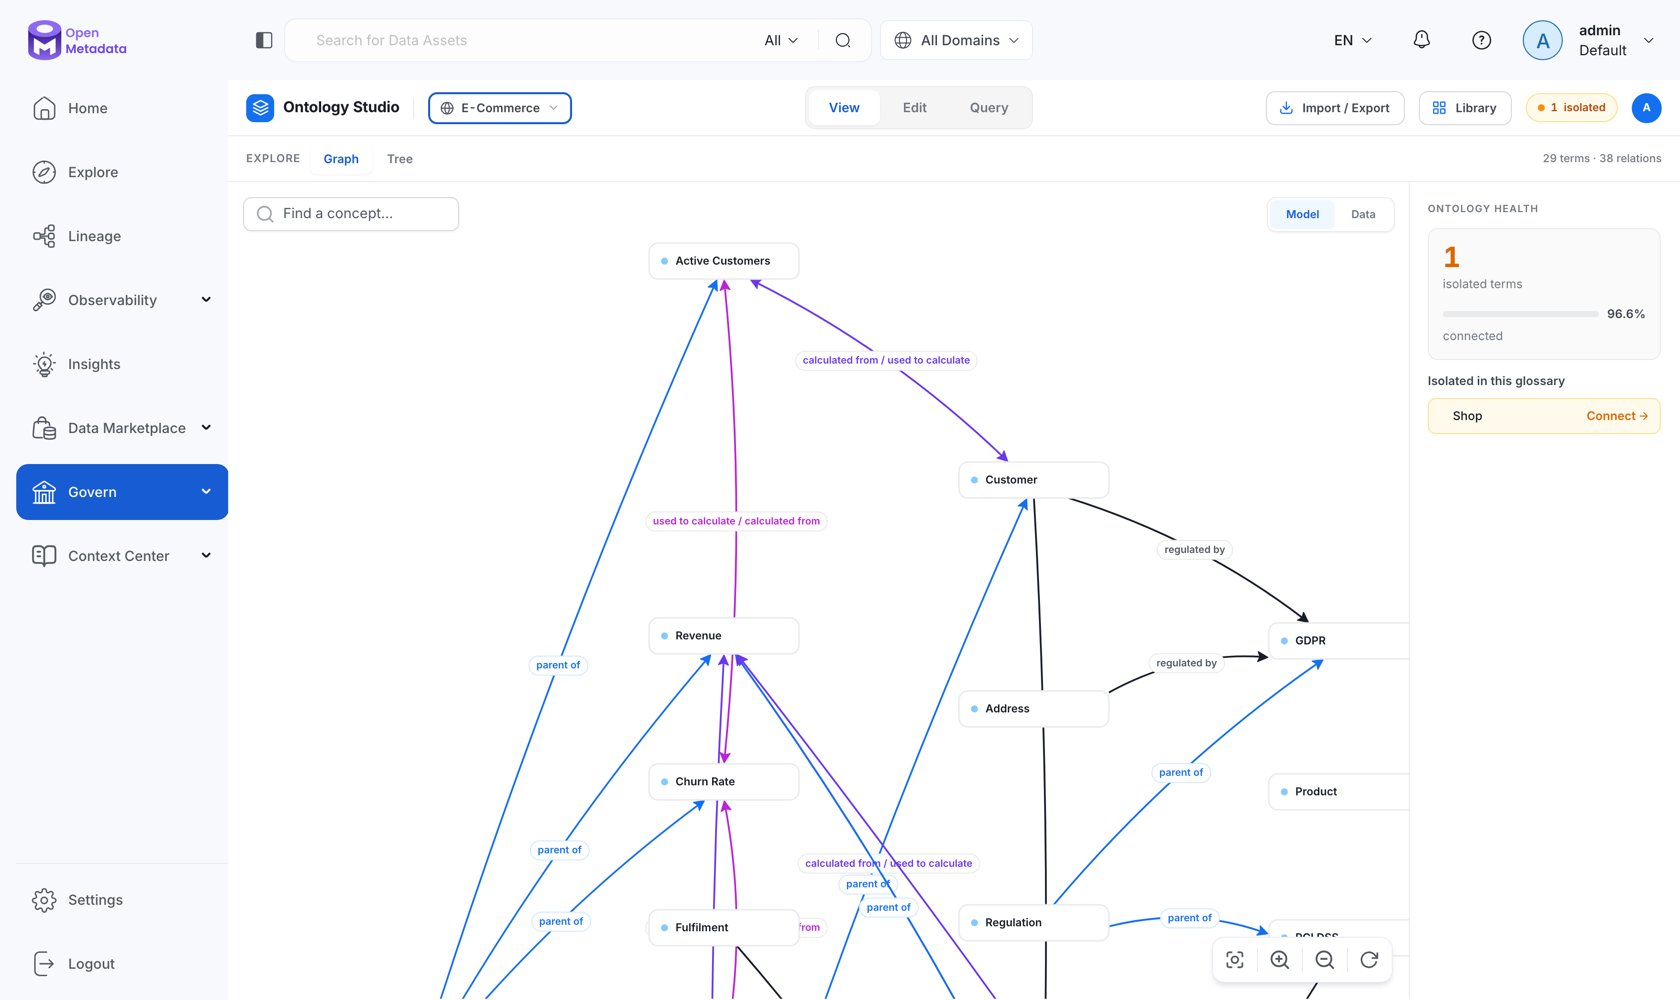
Model and Data
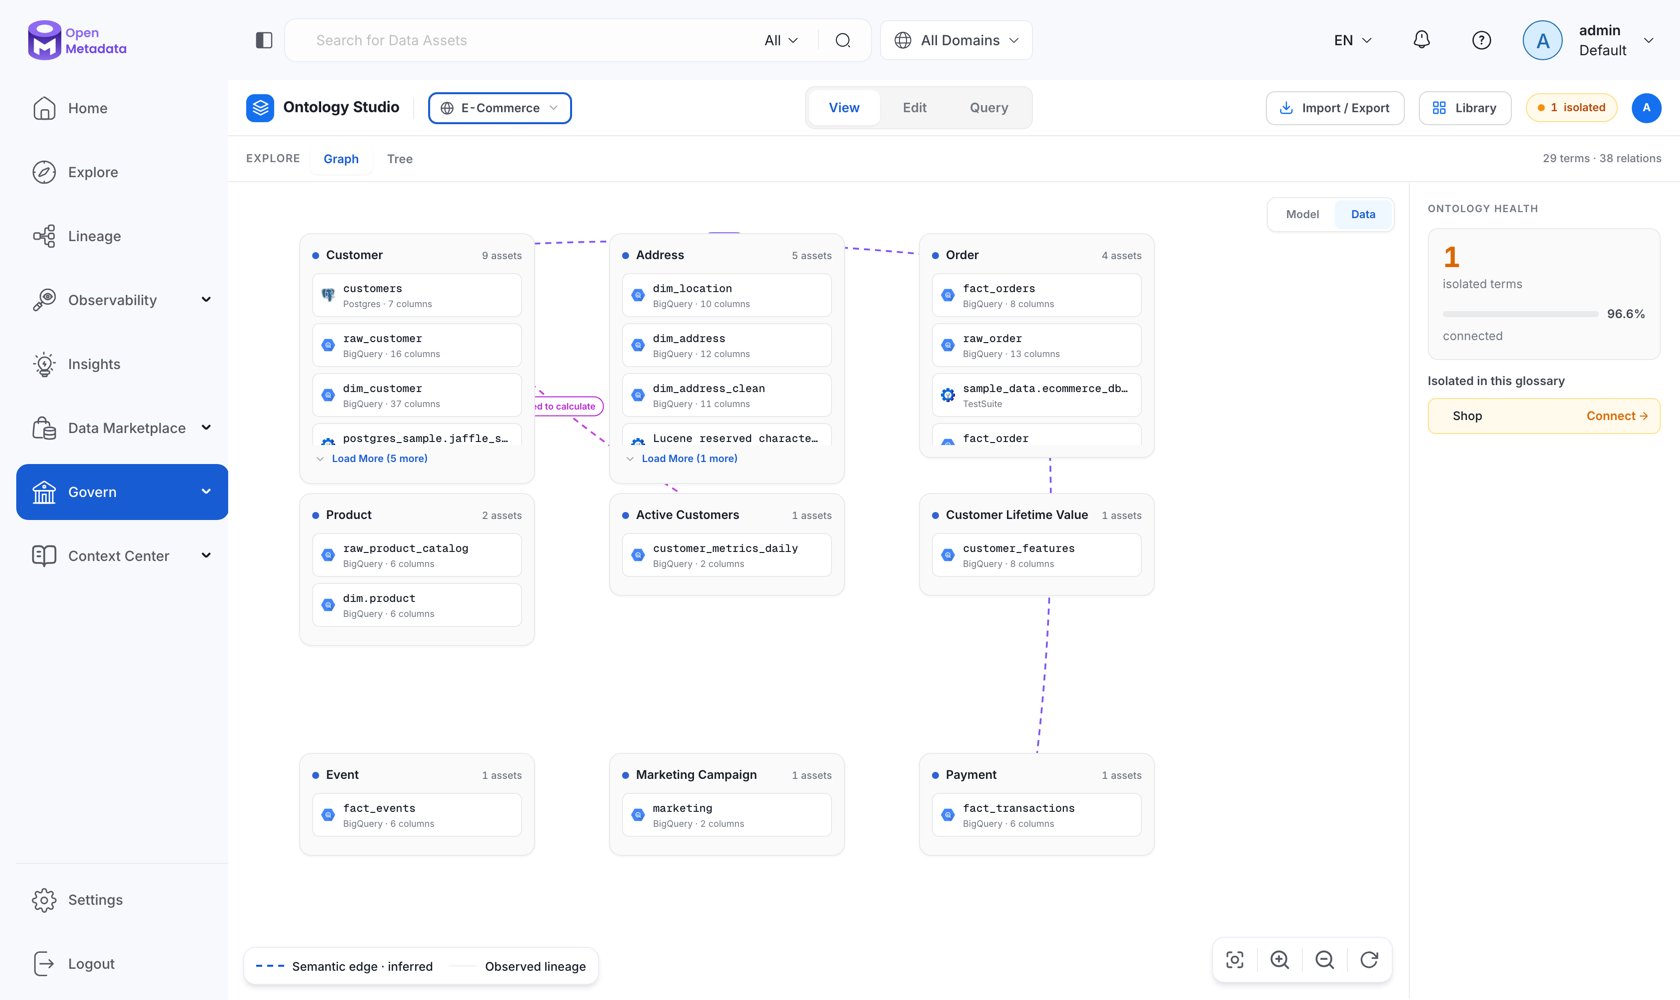
A Model / Data toggle on the canvas switches what the graph renders:- Model — the concept-to-concept ontology. The semantic layer on its own.
- Data — concepts plus the assets attached to them. Each concept becomes a cluster listing the tables, dashboards, and other assets carrying that term, with the service and column count on each card and a Load more link when a concept covers more assets than fit.
View Modes
The View Mode dropdown changes how the graph is arranged:Filters
Graph Settings
The settings panel controls:- Layout — Hierarchical (ranked, tree-like layers; good for following parent/child structure top-down) or Circular (good for surveying a cluster with no directional hierarchy).
- Edge labels — show or hide relationship-type labels on the connectors.
Export the Graph
Export Graph produces:
Semantic formats are exported through the glossary ontology exporter, so they are available whether or not RDF storage is enabled. See Import & Export for the full round-trip story.
Tree
The Tree surface lists concepts across the selected glossaries organized by hierarchy — the fastest way to audit structure rather than shape.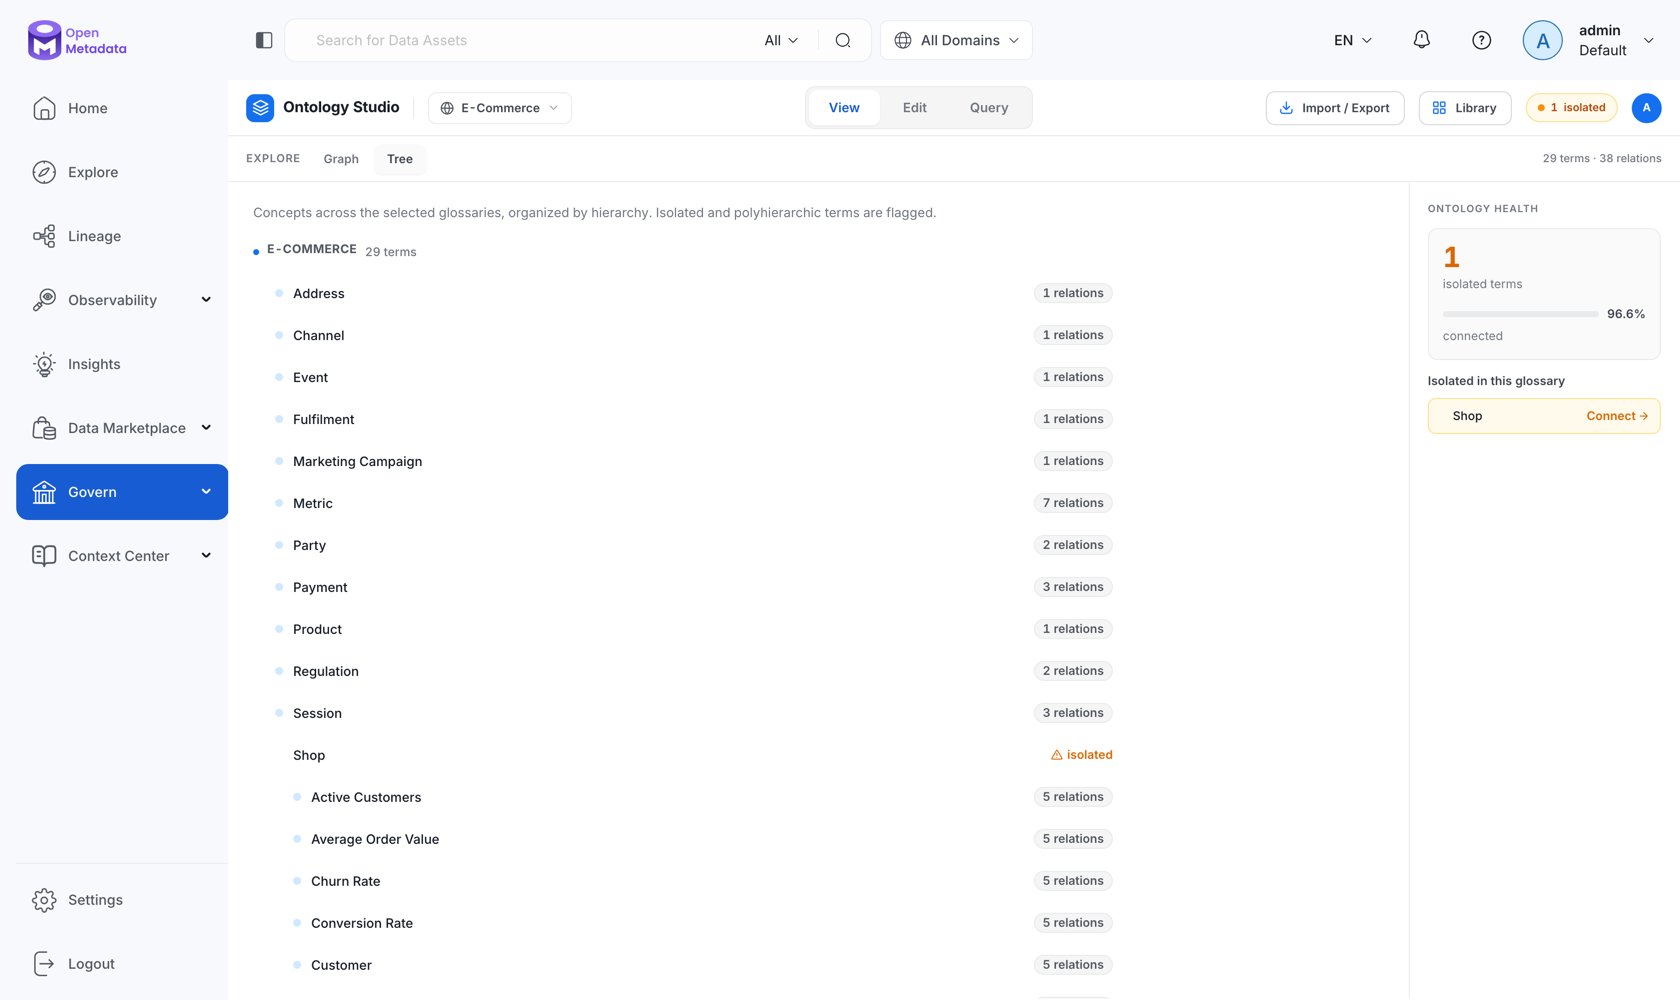
- Isolated — concepts with no relationships at all.
- Polyhierarchy — concepts with more than one parent. Legitimate in an ontology, but a frequent source of ambiguity when it was not intentional.
Ontology Health
View mode shows a health panel summarizing isolated versus connected concepts in the current scope, with an explicit “all visible terms connected” state when nothing needs fixing. The header also carries a live isolated badge in every mode. Isolation is the metric to drive down. A glossary of 400 unlinked terms and an ontology of 400 concepts look identical in a list view and behave completely differently for a query engine or an agent.The Inspector
Selecting a node or an edge opens a side panel. For a concept:- Name, description, glossary, and concept IRI.
- Relationships — every typed relation, in both directions, with the relationship type and target concept.
- Attributes — typed properties, with inherited attributes marked and attributed to the ancestor that declares them.
- Realization — the data assets carrying this concept, grouped by service, with counts and a link through to each asset.
- Mappings — external concept mappings with their match type.
Scoped View from a Glossary Term
The same graph is available scoped to a single concept from that term’s Relations Graph tab in the glossary, which is often the better entry point when you already know the concept you care about.Next
Author (Edit mode)
Draw relations, add attributes and axioms, run impact previews.
Query mode
Ask the questions the canvas can’t answer.