Mode
PRODIn this section, we provide guides and references to use the Mode connector.
Configure and schedule Mode metadata and profiler workflows from the OpenMetadata UI:
Ingestion Deployment
To run the Ingestion via the UI you'll need to use the OpenMetadata Ingestion Container, which comes shipped with custom Airflow plugins to handle the workflow deployment. If you want to install it manually in an already existing Airflow host, you can follow this guide.
If you don't want to use the OpenMetadata Ingestion container to configure the workflows via the UI, then you can check the following docs to run the Ingestion Framework in any orchestrator externally.
Run Connectors from the OpenMetadata UI
Learn how to manage your deployment to run connectors from the UIRun the Connector Externally
Get the YAML to run the ingestion externallyExternal Schedulers
Get more information about running the Ingestion Framework ExternallyRequirements
OpenMetadata relies on Mode's API, which is exclusive to members of the Mode Business Workspace. This means that only resources that belong to a Mode Business Workspace can be accessed via the API.
Metadata Ingestion
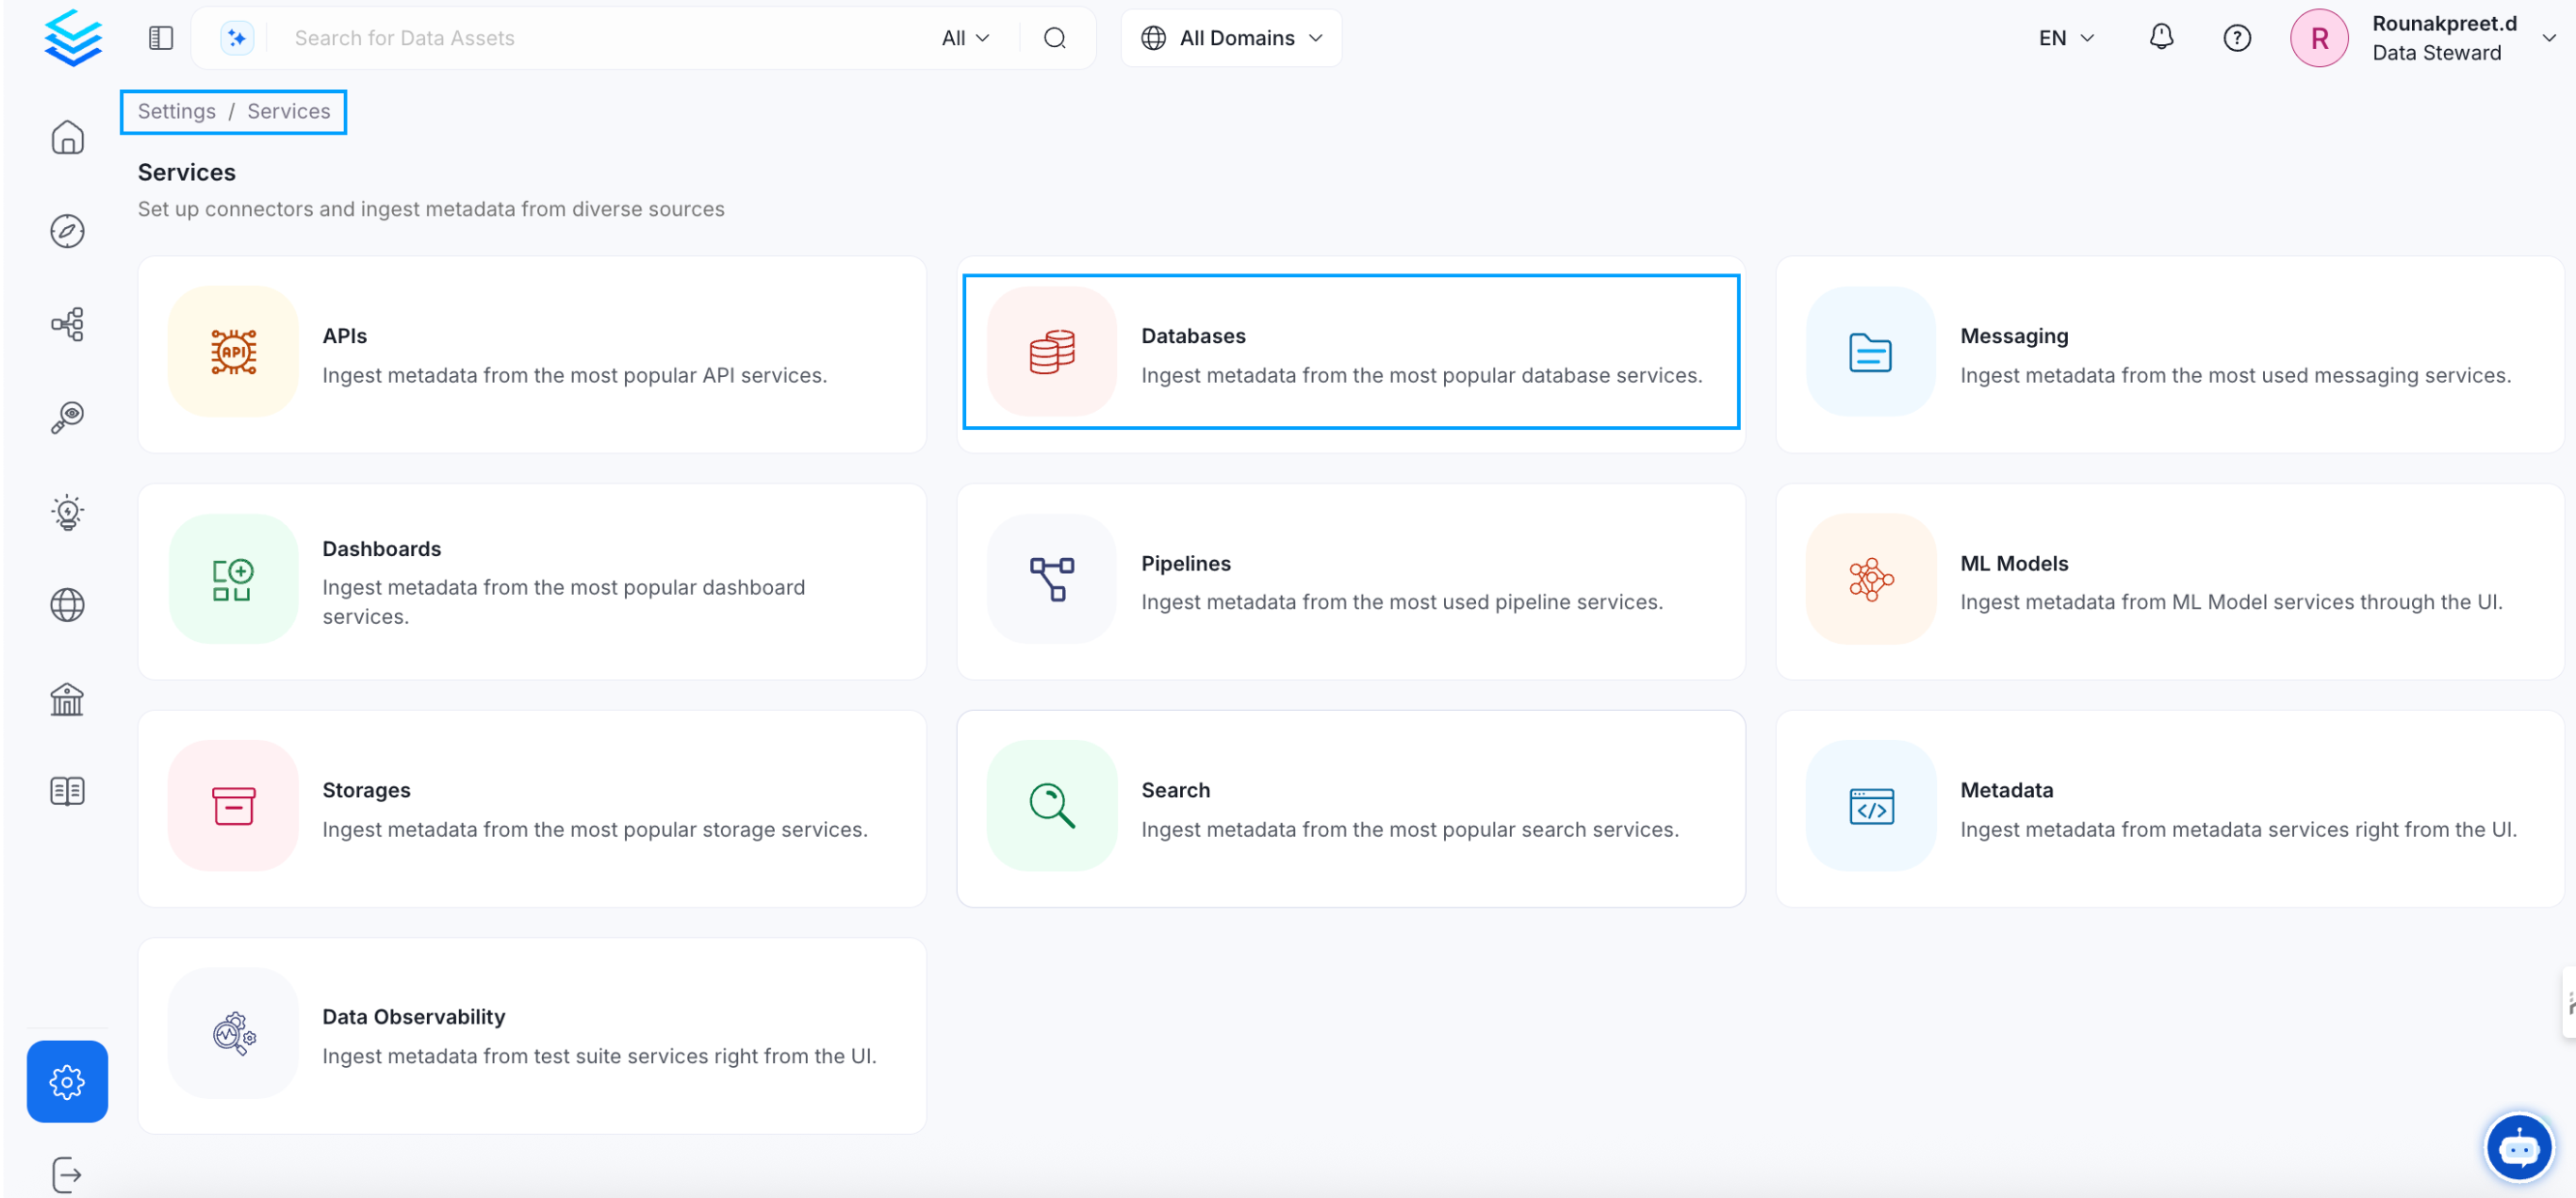
1. Visit the Services Page
Click Settings in the side navigation bar and then Services.
The first step is to ingest the metadata from your sources. To do that, you first need to create a Service connection first.
This Service will be the bridge between OpenMetadata and your source system.
Once a Service is created, it can be used to configure your ingestion workflows.
Select your Service Type and Add a New Service
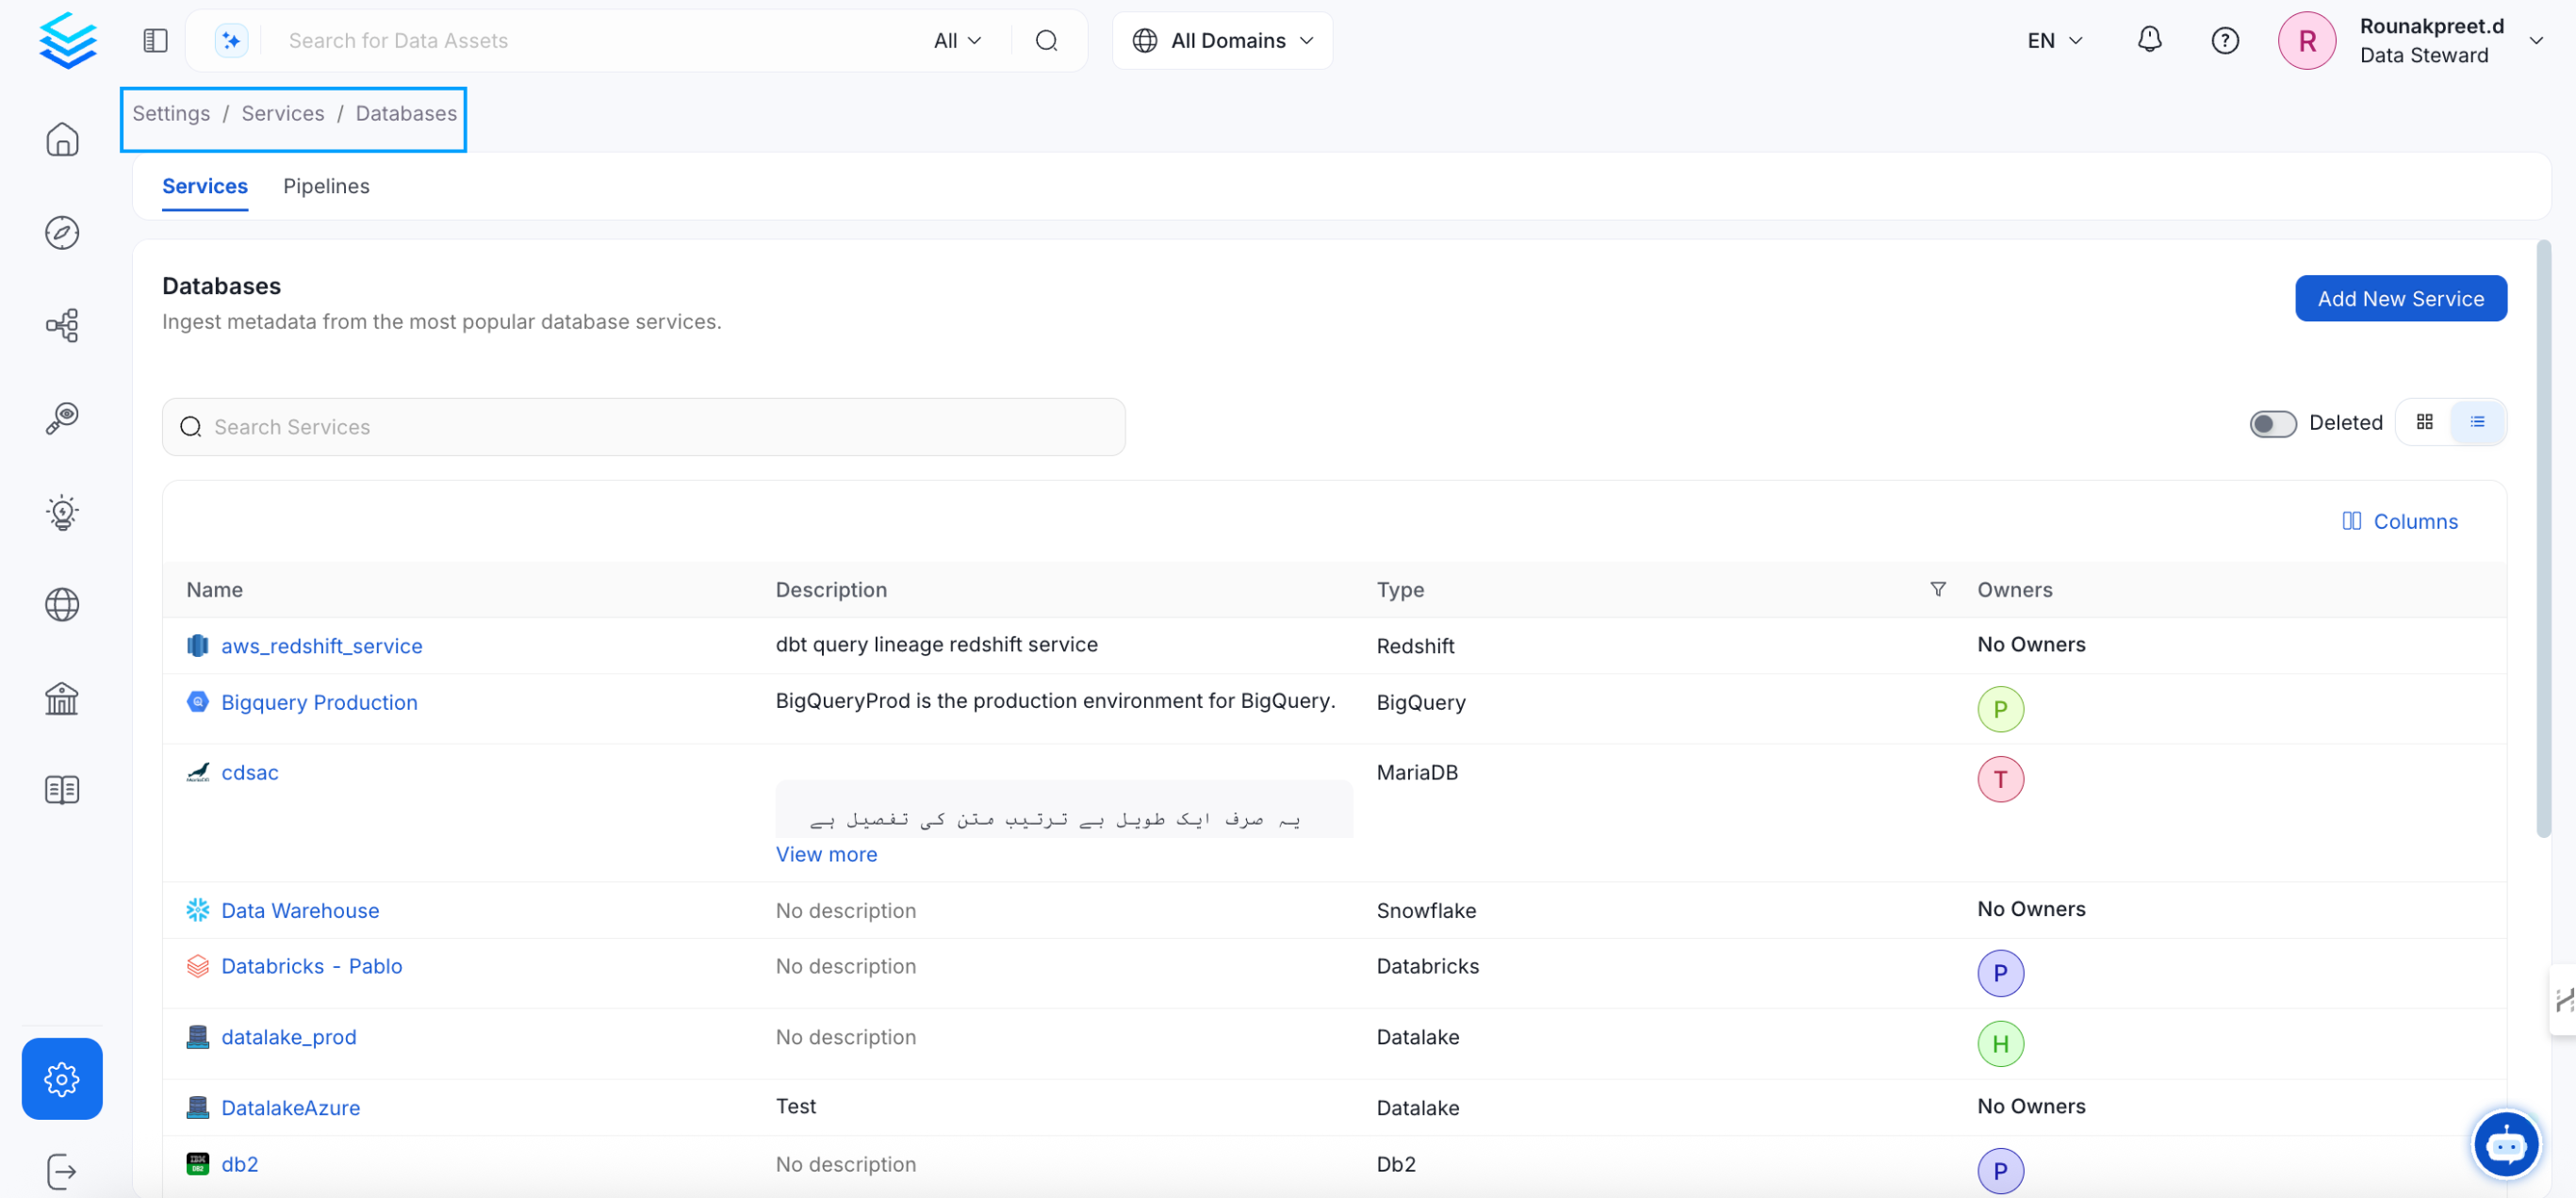
Add a new Service from the Services page
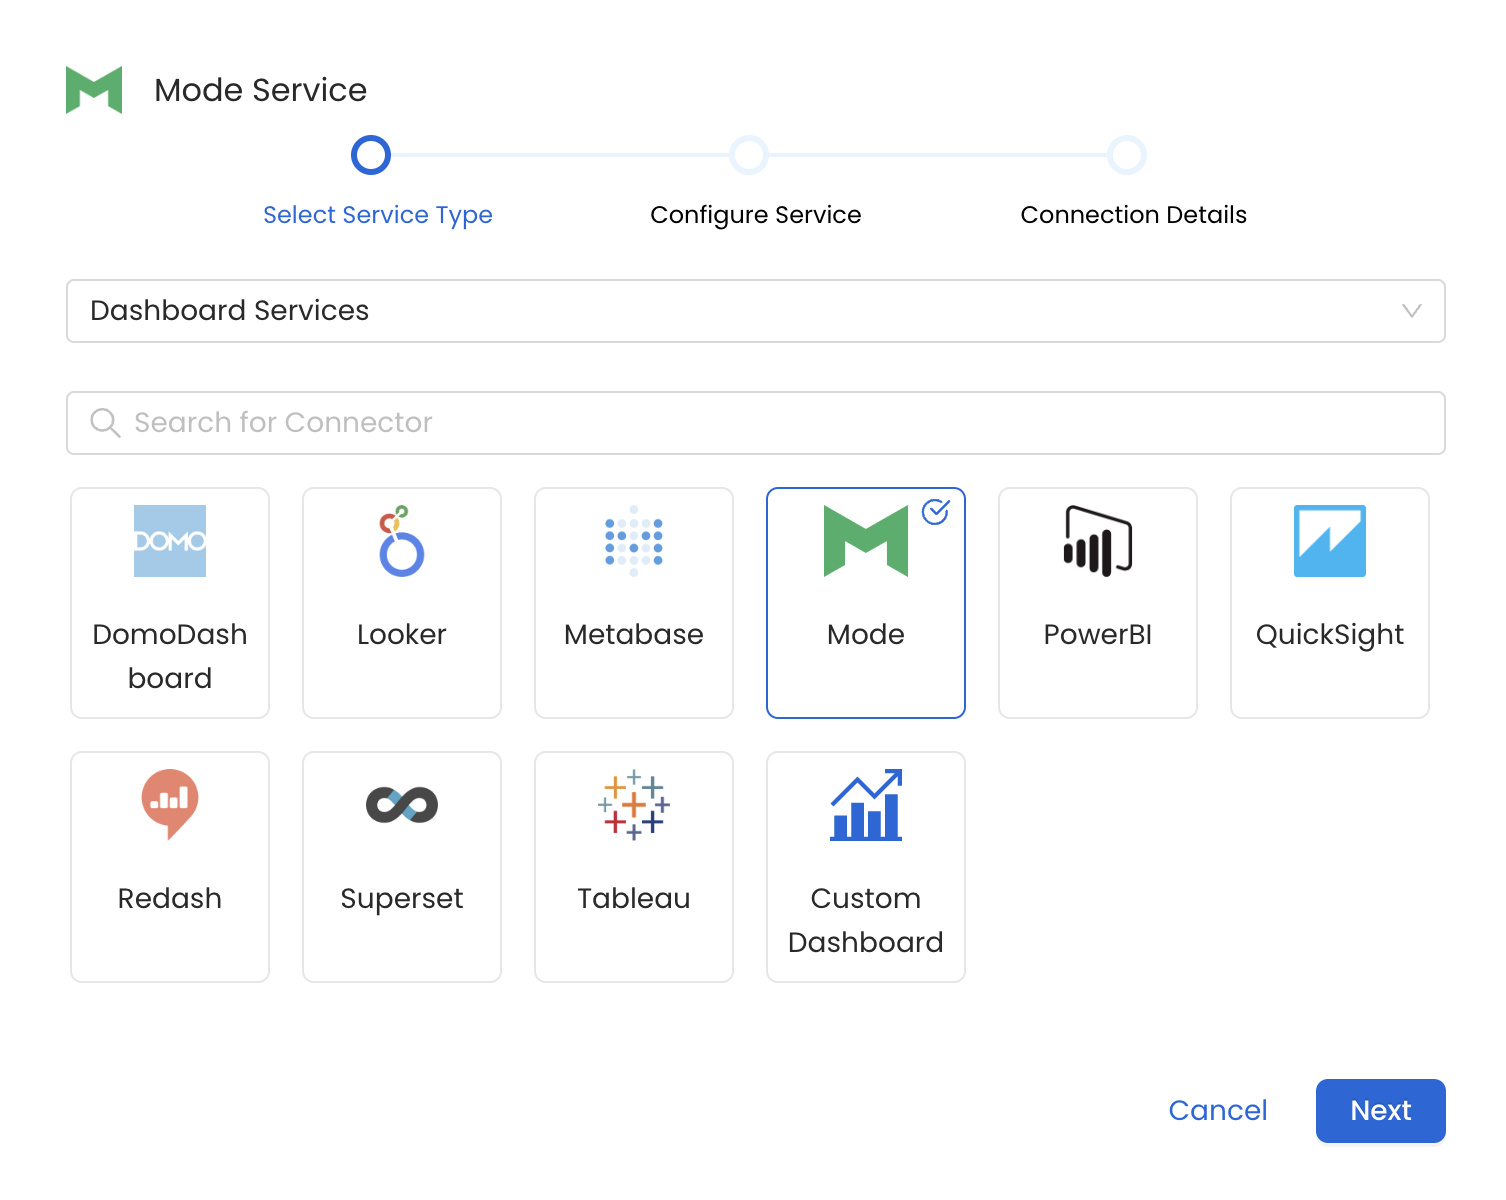
Select your Service from the list
4. Name and Describe your Service
Provide a name and description for your Service.
Service Name
OpenMetadata uniquely identifies Services by their Service Name. Provide a name that distinguishes your deployment from other Services, including the other Mode Services that you might be ingesting metadata from.
Note that when the name is set, it cannot be changed.
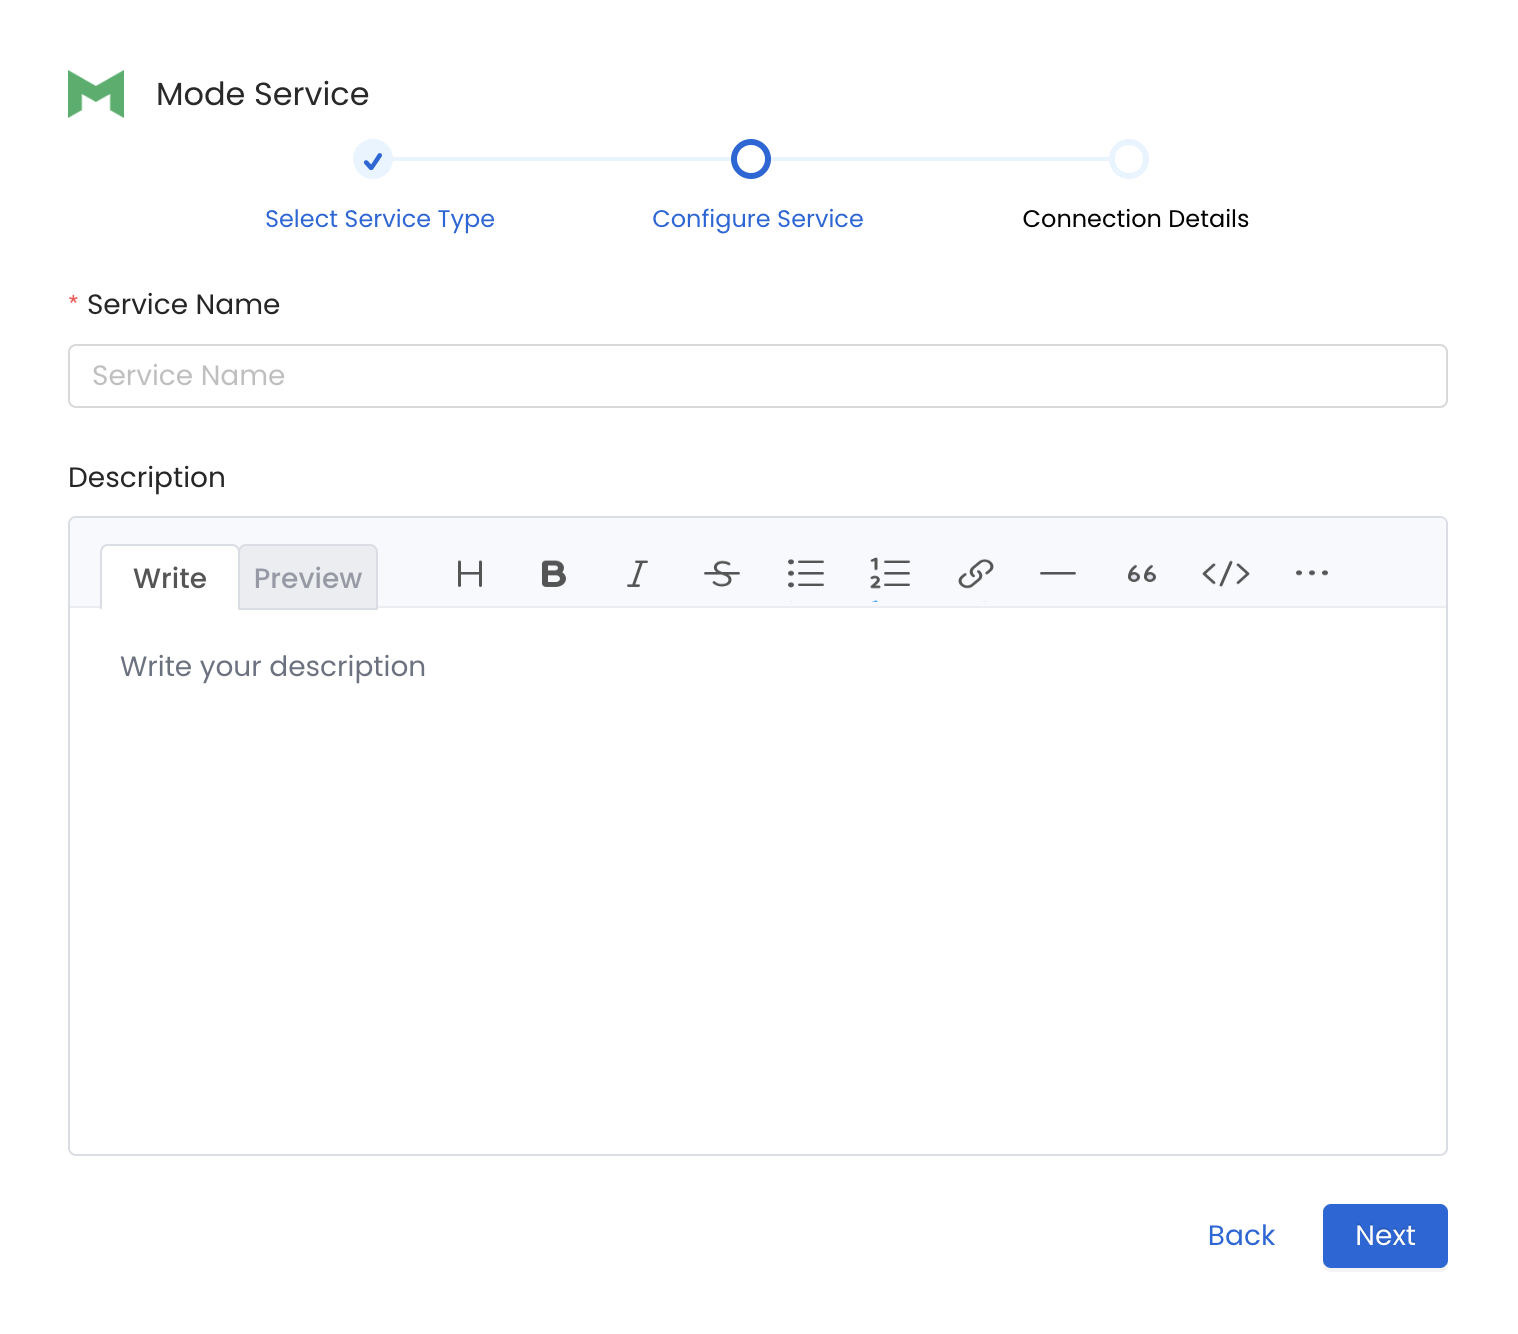
Provide a Name and description for your Service
5. Configure the Service Connection
In this step, we will configure the connection settings required for Mode.
Please follow the instructions below to properly configure the Service to read from your sources. You will also find helper documentation on the right-hand side panel in the UI.
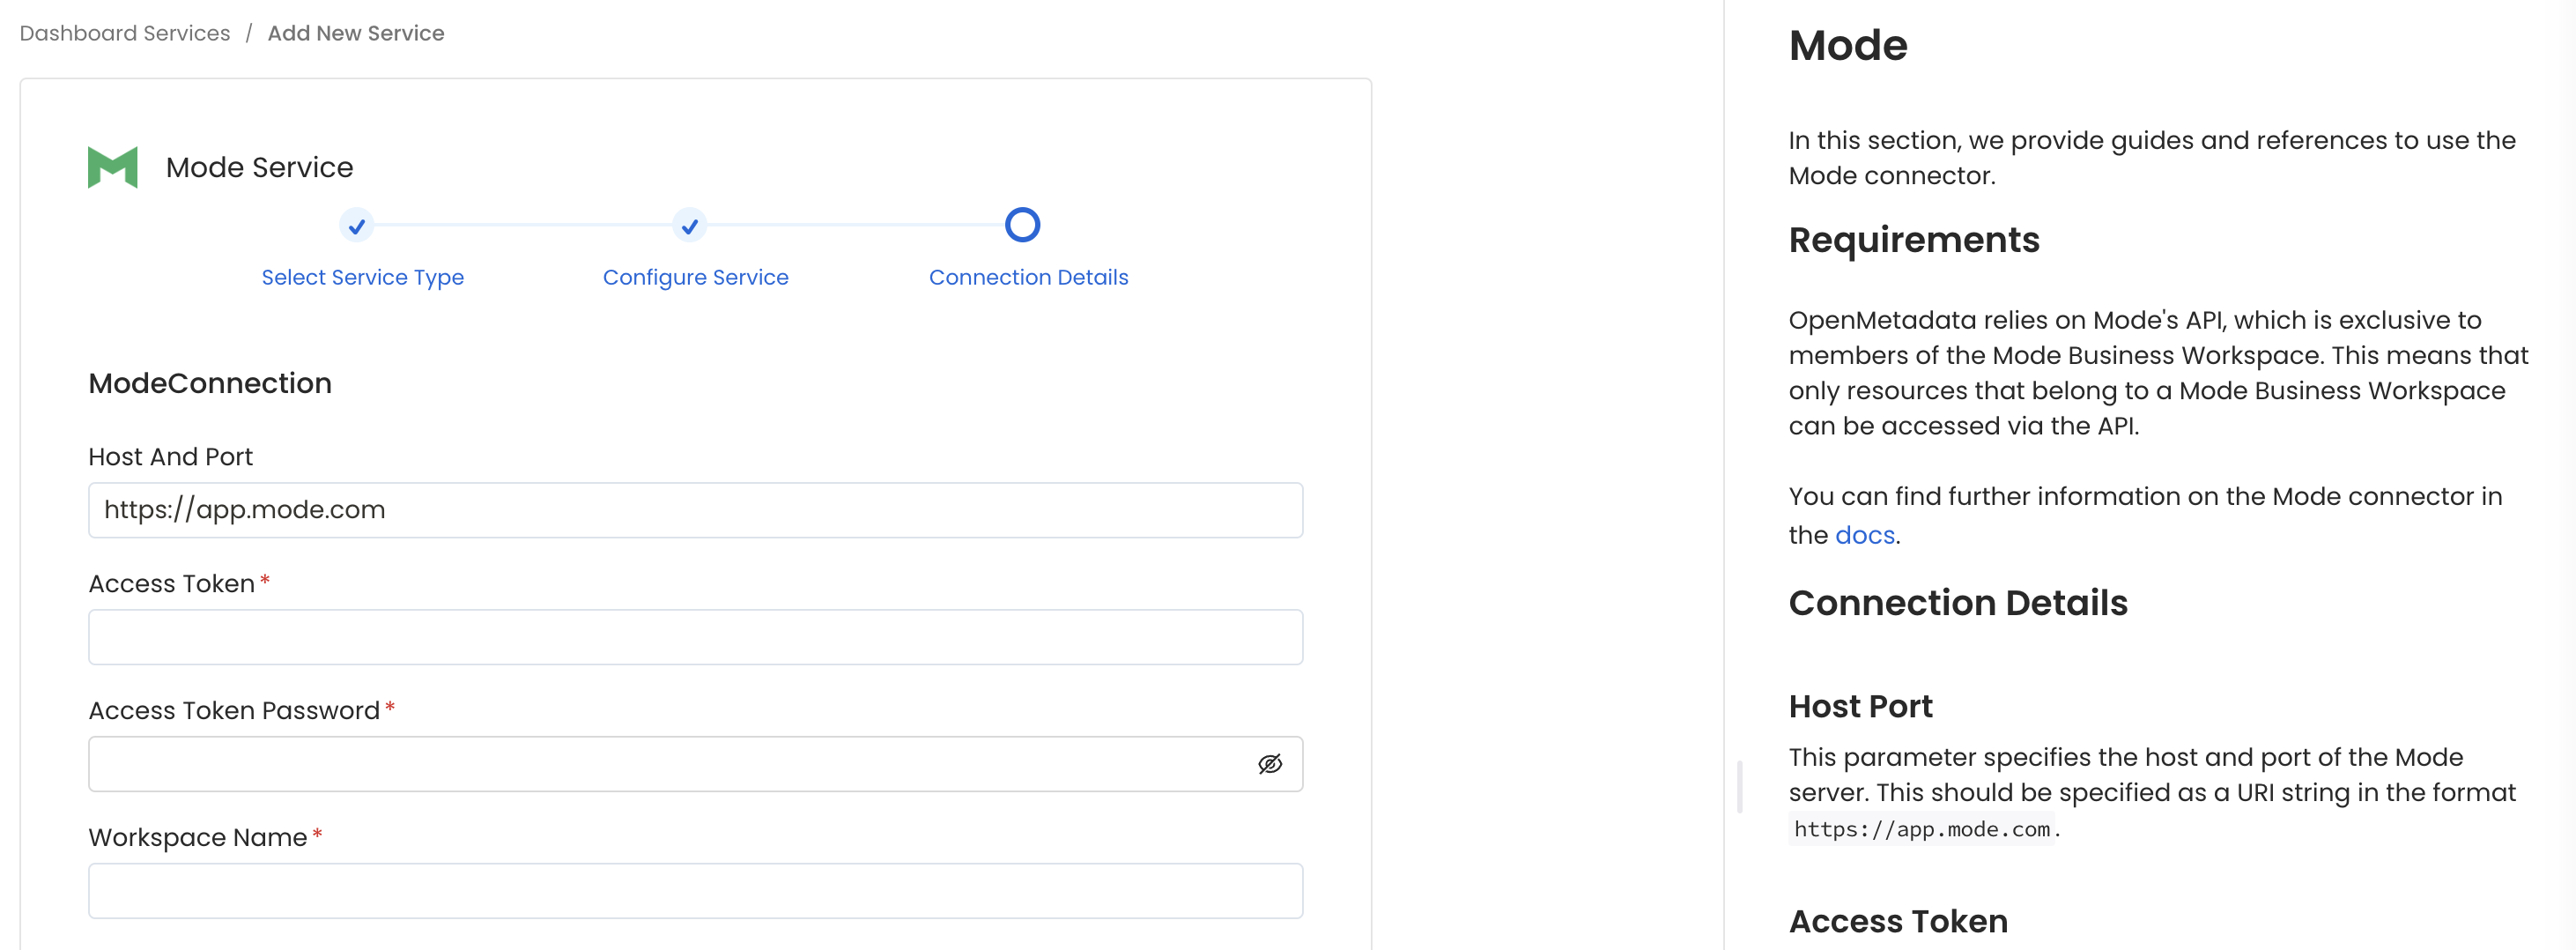
Configure the Service connection by filling the form
Connection Details
hostPort: Host and Port Mode Dashboard. The hostPort parameter specifies the host and port of the Mode server. This should be specified as a string in the format https://app.mode.com.
accessToken: Access Token for Mode Dashboard. Get the Access Token by following below steps:
- Navigate to your Mode homepage.
- Click on your name in the upper left corner and click My Account.
- Click on API Tokens on the left side.
- To generate a new API token and password, enter a token name and click
Create token. - Copy the generated access token and password.
For detailed information visit here.
accessTokenPassword: Access Token Password for Mode Dashboard. Copy the access token password from the step above where a new token is generated.
For detailed information visit here.
workspaceName: Mode Workspace Name. Name of the mode workspace from where the metadata is to be fetched.
6. Test the Connection
Once the credentials have been added, click on Test Connection and Save the changes.
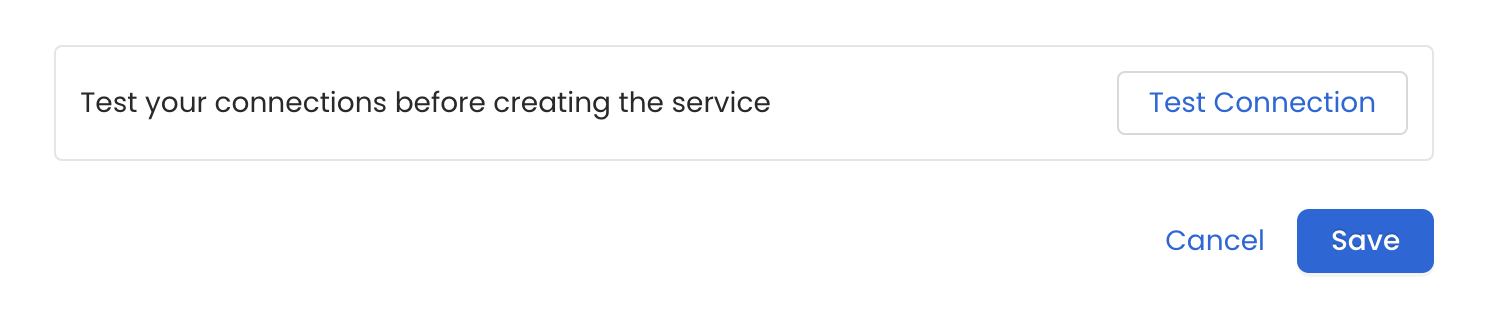
Test the connection and save the Service
7. Configure Metadata Ingestion
In this step we will configure the metadata ingestion pipeline, Please follow the instructions below
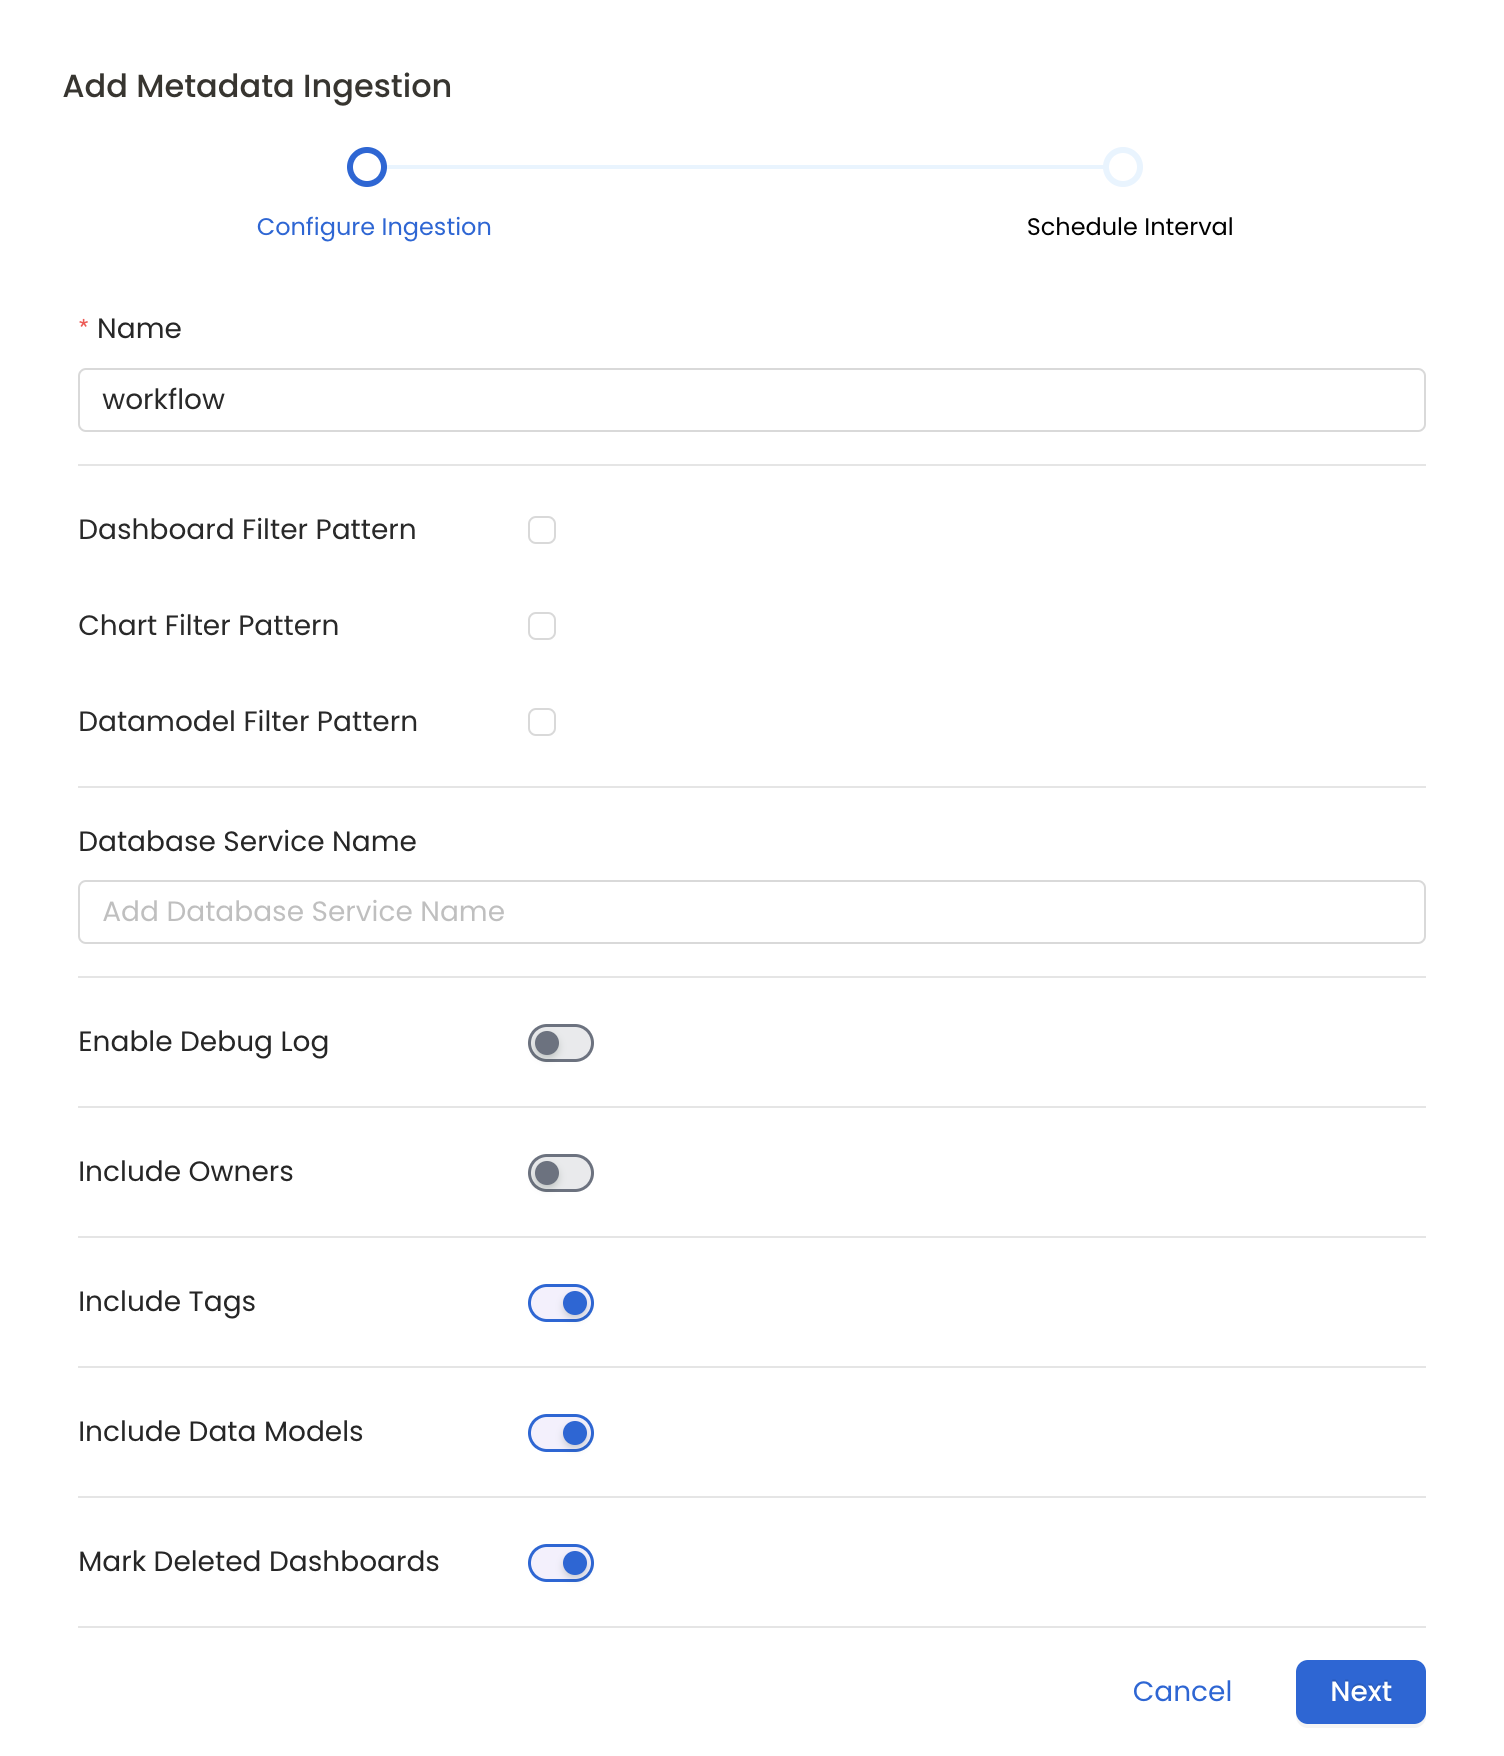
Configure Metadata Ingestion Page
Metadata Ingestion Options
- Name: This field refers to the name of ingestion pipeline, you can customize the name or use the generated name.
- Dashboard Filter Pattern (Optional): Use it to control whether to include dashboard as part of metadata ingestion.
- Include: Explicitly include dashboards by adding a list of comma-separated regular expressions to the 'Include' field. OpenMetadata will include all dashboards with names matching one or more of the supplied regular expressions. All other dashboards will be excluded.
- Exclude: Explicitly exclude dashboards by adding a list of comma-separated regular expressions to the 'Exclude' field. OpenMetadata will exclude all dashboards with names matching one or more of the supplied regular expressions. All other dashboards will be included.
- projectFilterPattern: Filter the dashboards, charts and data sources by projects. Note that all of them support regex as include or exclude. E.g., "My project, My proj.*, .*Project".
We filter the projects by concatenating the entire project hierarchy using dot notation
(e.g., Project1.NestedProjectA.OtherProject).
Make sure the regex filter pattern accounts for this fully-qualified format.
- Chart Pattern (Optional): Use it to control whether to include charts as part of metadata ingestion.
- Include: Explicitly include charts by adding a list of comma-separated regular expressions to the 'Include' field. OpenMetadata will include all charts with names matching one or more of the supplied regular expressions. All other charts will be excluded.
- Exclude: Explicitly exclude charts by adding a list of comma-separated regular expressions to the 'Exclude' field. OpenMetadata will exclude all charts with names matching one or more of the supplied regular expressions. All other charts will be included.
- Data Model Pattern (Optional): Use it to control whether to include data modes as part of metadata ingestion.
- Include: Explicitly include data models by adding a list of comma-separated regular expressions to the 'Include' field. OpenMetadata will include all data models with names matching one or more of the supplied regular expressions. All other data models will be excluded.
- Exclude: Explicitly exclude data models by adding a list of comma-separated regular expressions to the 'Exclude' field. OpenMetadata will exclude all data models with names matching one or more of the supplied regular expressions. All other data models will be included.
- Db Service Prefixes (Optional): Enter the names of Database Services which are already ingested in OpenMetadata to create lineage between dashboards and database tables.
- Enable Debug Log (toggle): Set the 'Enable Debug Log' toggle to set the default log level to debug.
- Include Owners (toggle): Set the 'Include Owners' toggle to control whether to include owners to the ingested entity if the owner email matches with a user stored in the OM server as part of metadata ingestion. If the ingested entity already exists and has an owner, the owner will not be overwritten.
- Include Tags (toggle): Set the 'Include Tags' toggle to control whether to include tags in metadata ingestion.
- Include Data Models (toggle): Set the 'Include Data Models' toggle to control whether to include tags as part of metadata ingestion.
- Mark Deleted Dashboards (toggle): Set the 'Mark Deleted Dashboards' toggle to flag dashboards as soft-deleted if they are not present anymore in the source system.
- Include Draft Dashboard (toggle): Set the 'Include Draft Dashboard' toggle to include draft dashboards. By default it will include draft dashboards.
8. Schedule the Ingestion and Deploy
Scheduling can be set up at an hourly, daily, weekly, or manual cadence. The timezone is in UTC. Select a Start Date to schedule for ingestion. It is optional to add an End Date.
Review your configuration settings. If they match what you intended, click Deploy to create the service and schedule metadata ingestion.
If something doesn't look right, click the Back button to return to the appropriate step and change the settings as needed.
After configuring the workflow, you can click on Deploy to create the pipeline.
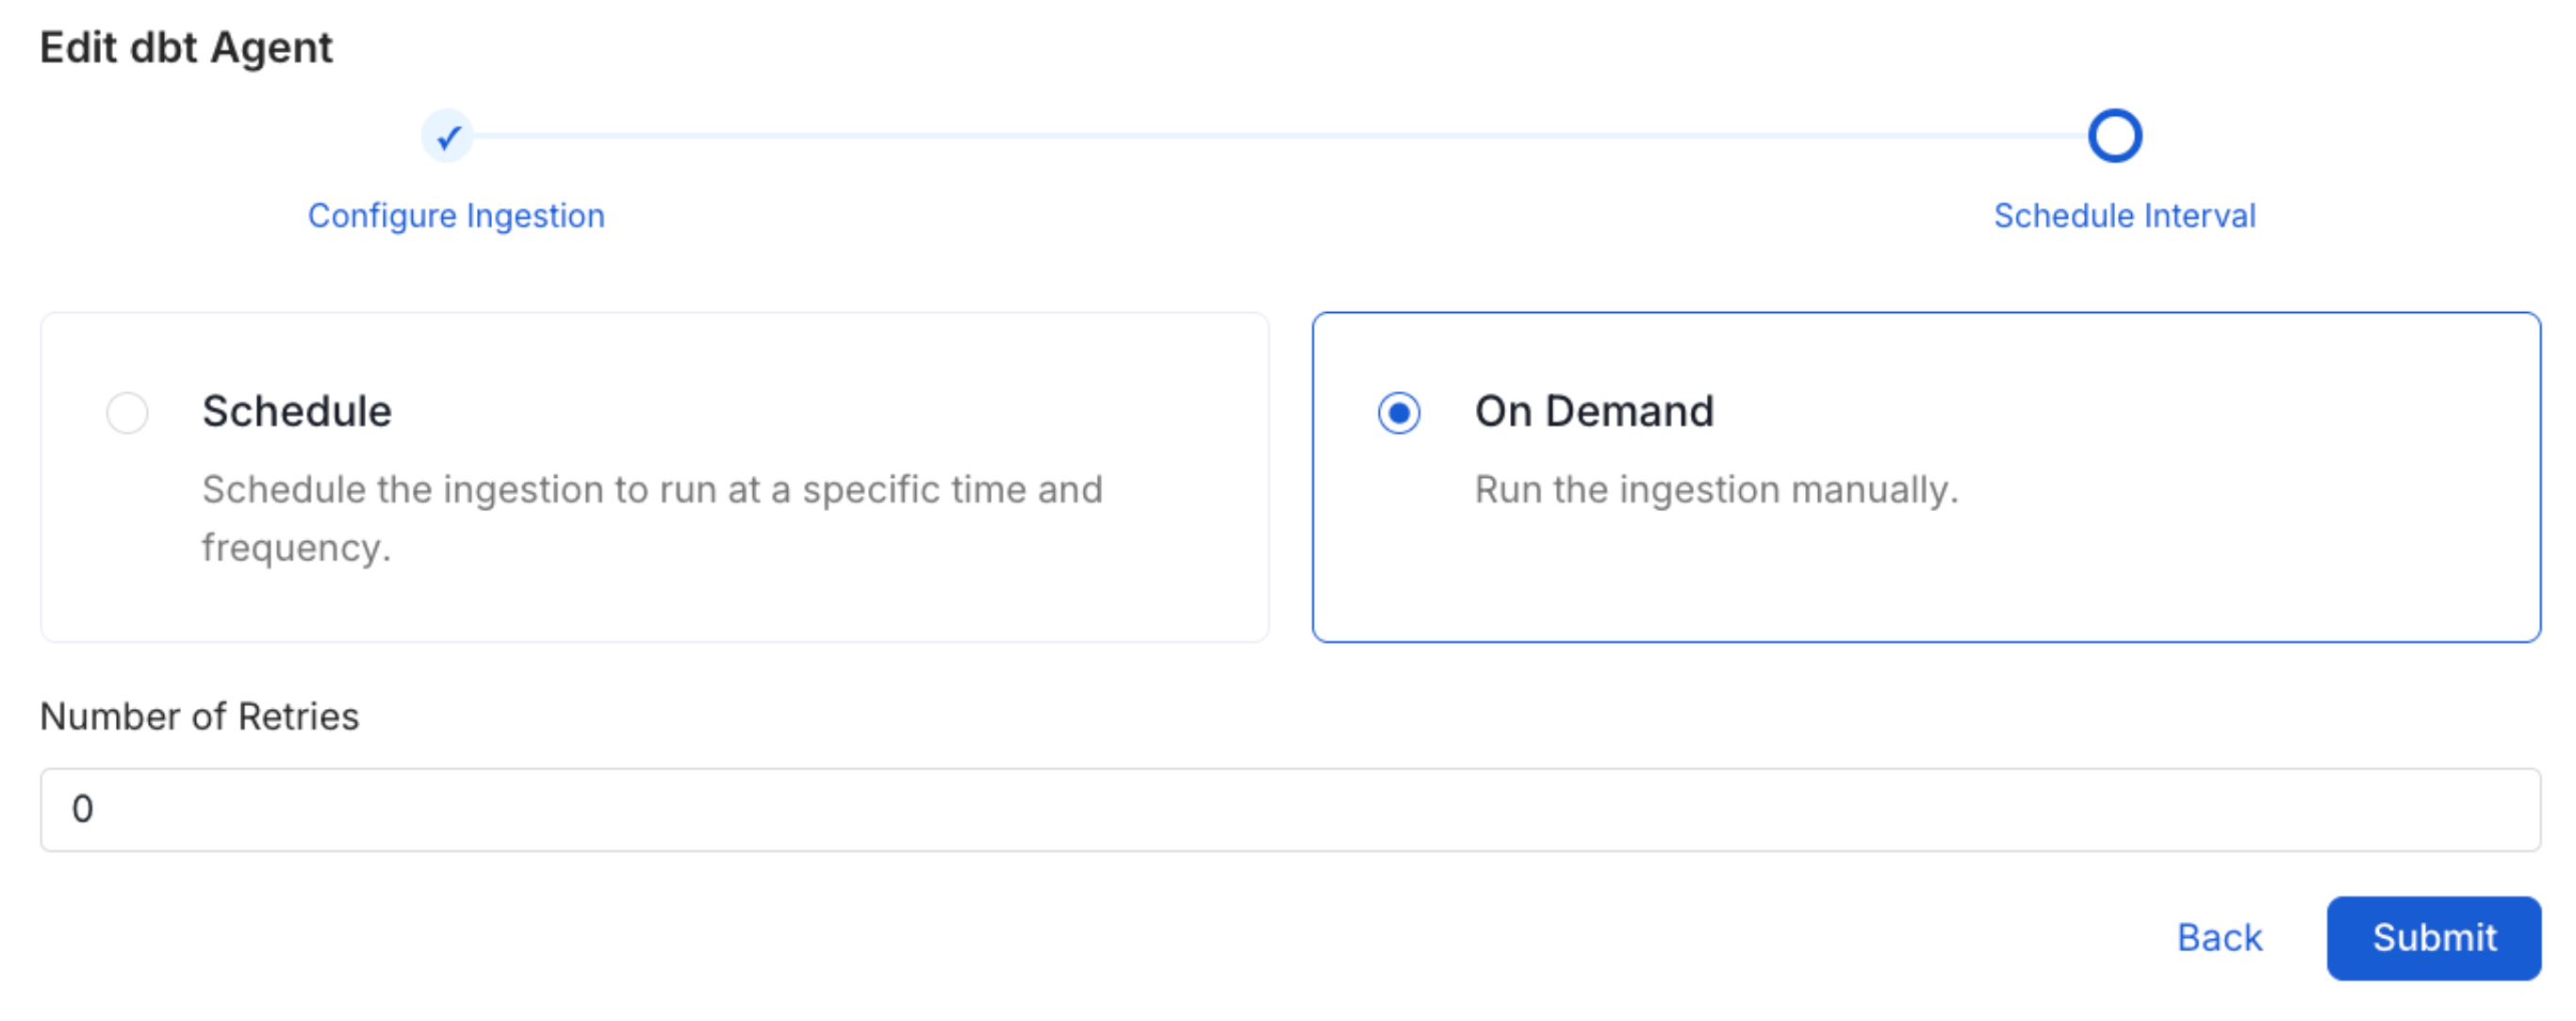
Schedule the Ingestion Pipeline and Deploy
Lineage
To establish lineage from your database tables to dashboards, you must add the corresponding database service name.
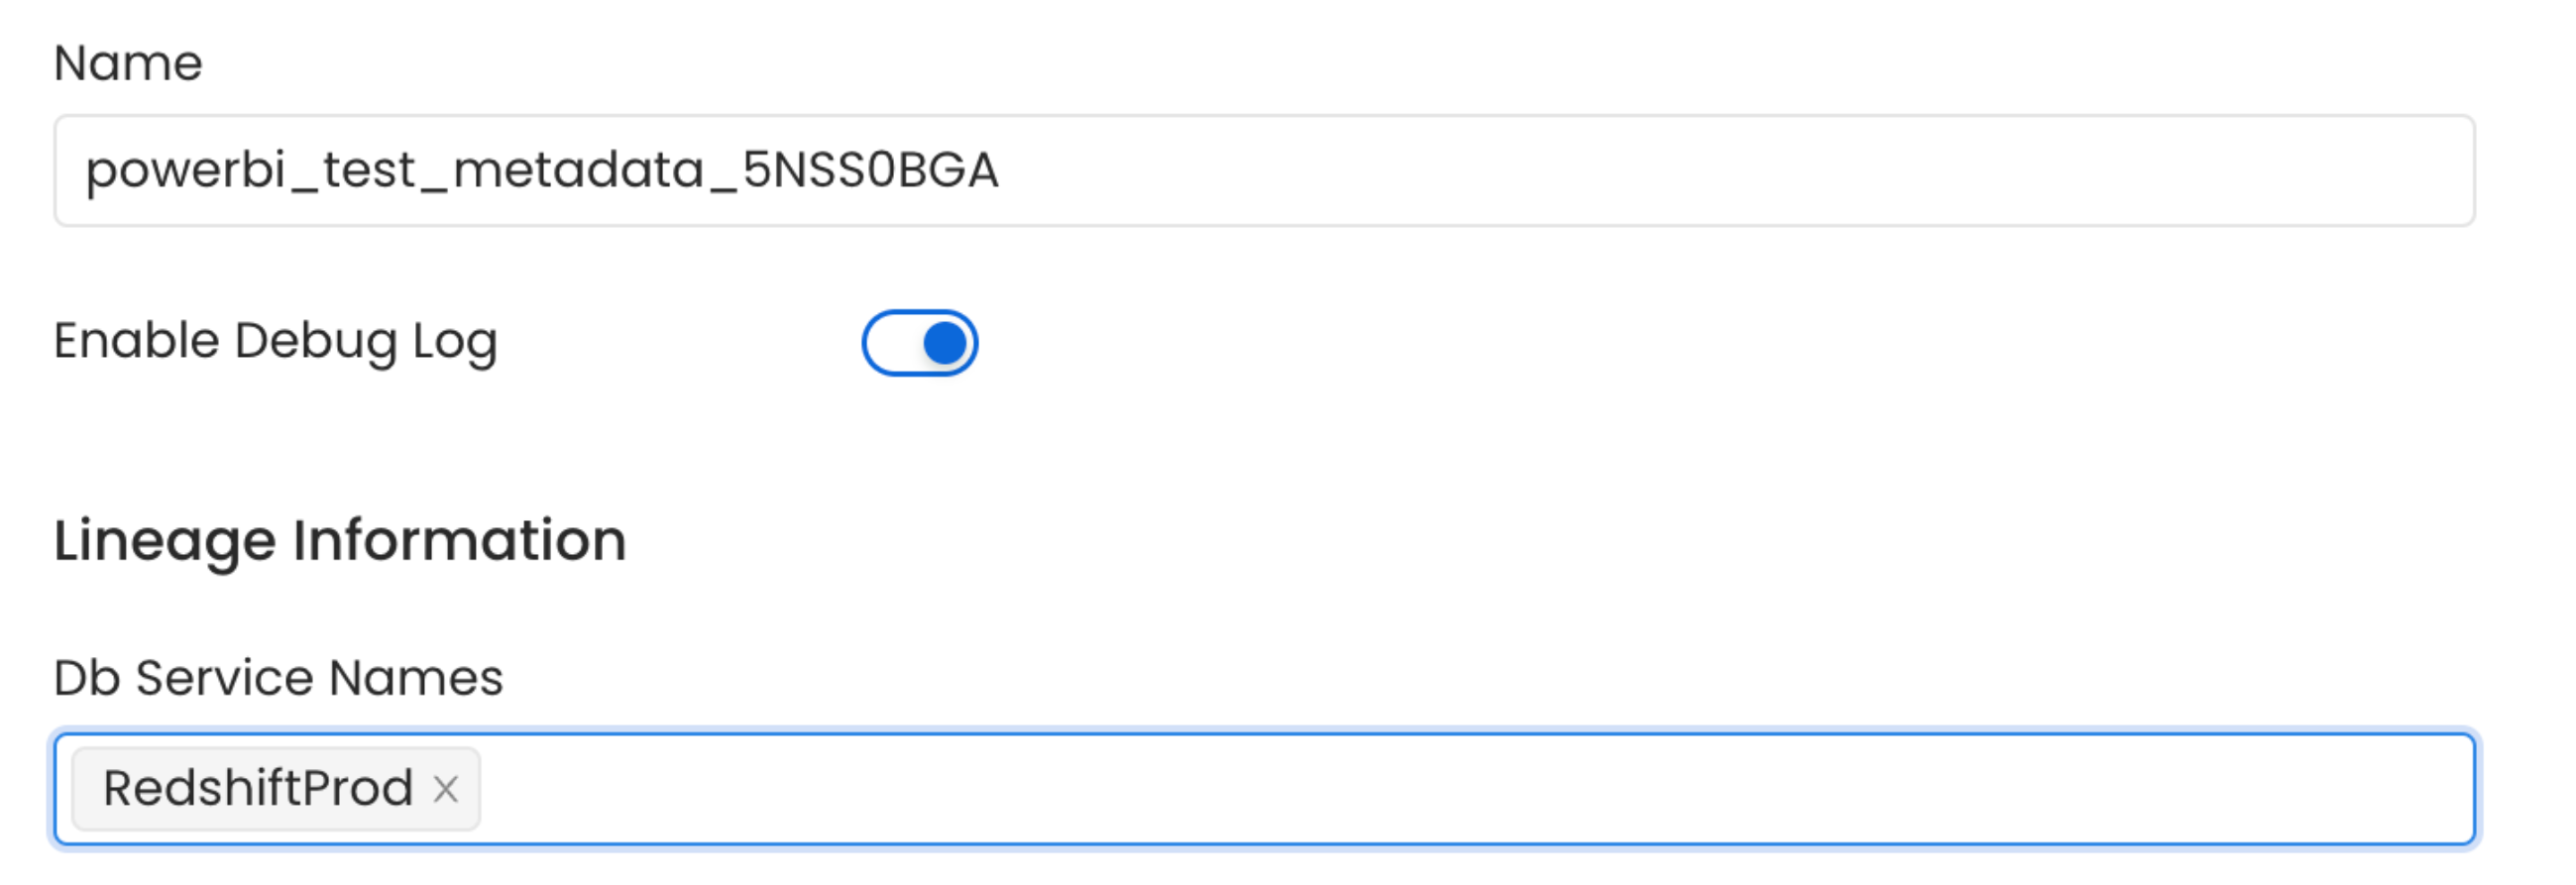
Lineage in Dashboard