
Custom Metrics
Custom metrics in OpenMetadata enhance profiling capabilities by enabling users to define and compute unique business metrics using custom SQL queries. These metrics can be added at both the table and column levels, allowing tailored analysis specific to organizational needs. Once defined, custom metrics are incorporated into the profiler workflow, and their computed values are displayed alongside system metrics in the table and column profiles. This feature provides a flexible way to track specific data insights, empowering users to gain deeper visibility into their datasets.Table-Level Metrics
- Navigate to the Database and switch to the Data Observability tab. Click on Table Profile, and on the right-hand side, select the Add option to access the custom metric feature.

- In the Add Table metric drawer on the right side of the page, enter a meaningful name for the custom metric and the SQL Query, then click Create. The SQL field is a code editor. The new metric’s graph appears without a page reload.
- Once the custom metric is defined, run the Profiler Agent in the Database Services.

- After running the profiler agent, return to the same dataset to view the computed custom metric within the table profile.

Column-Level Metrics
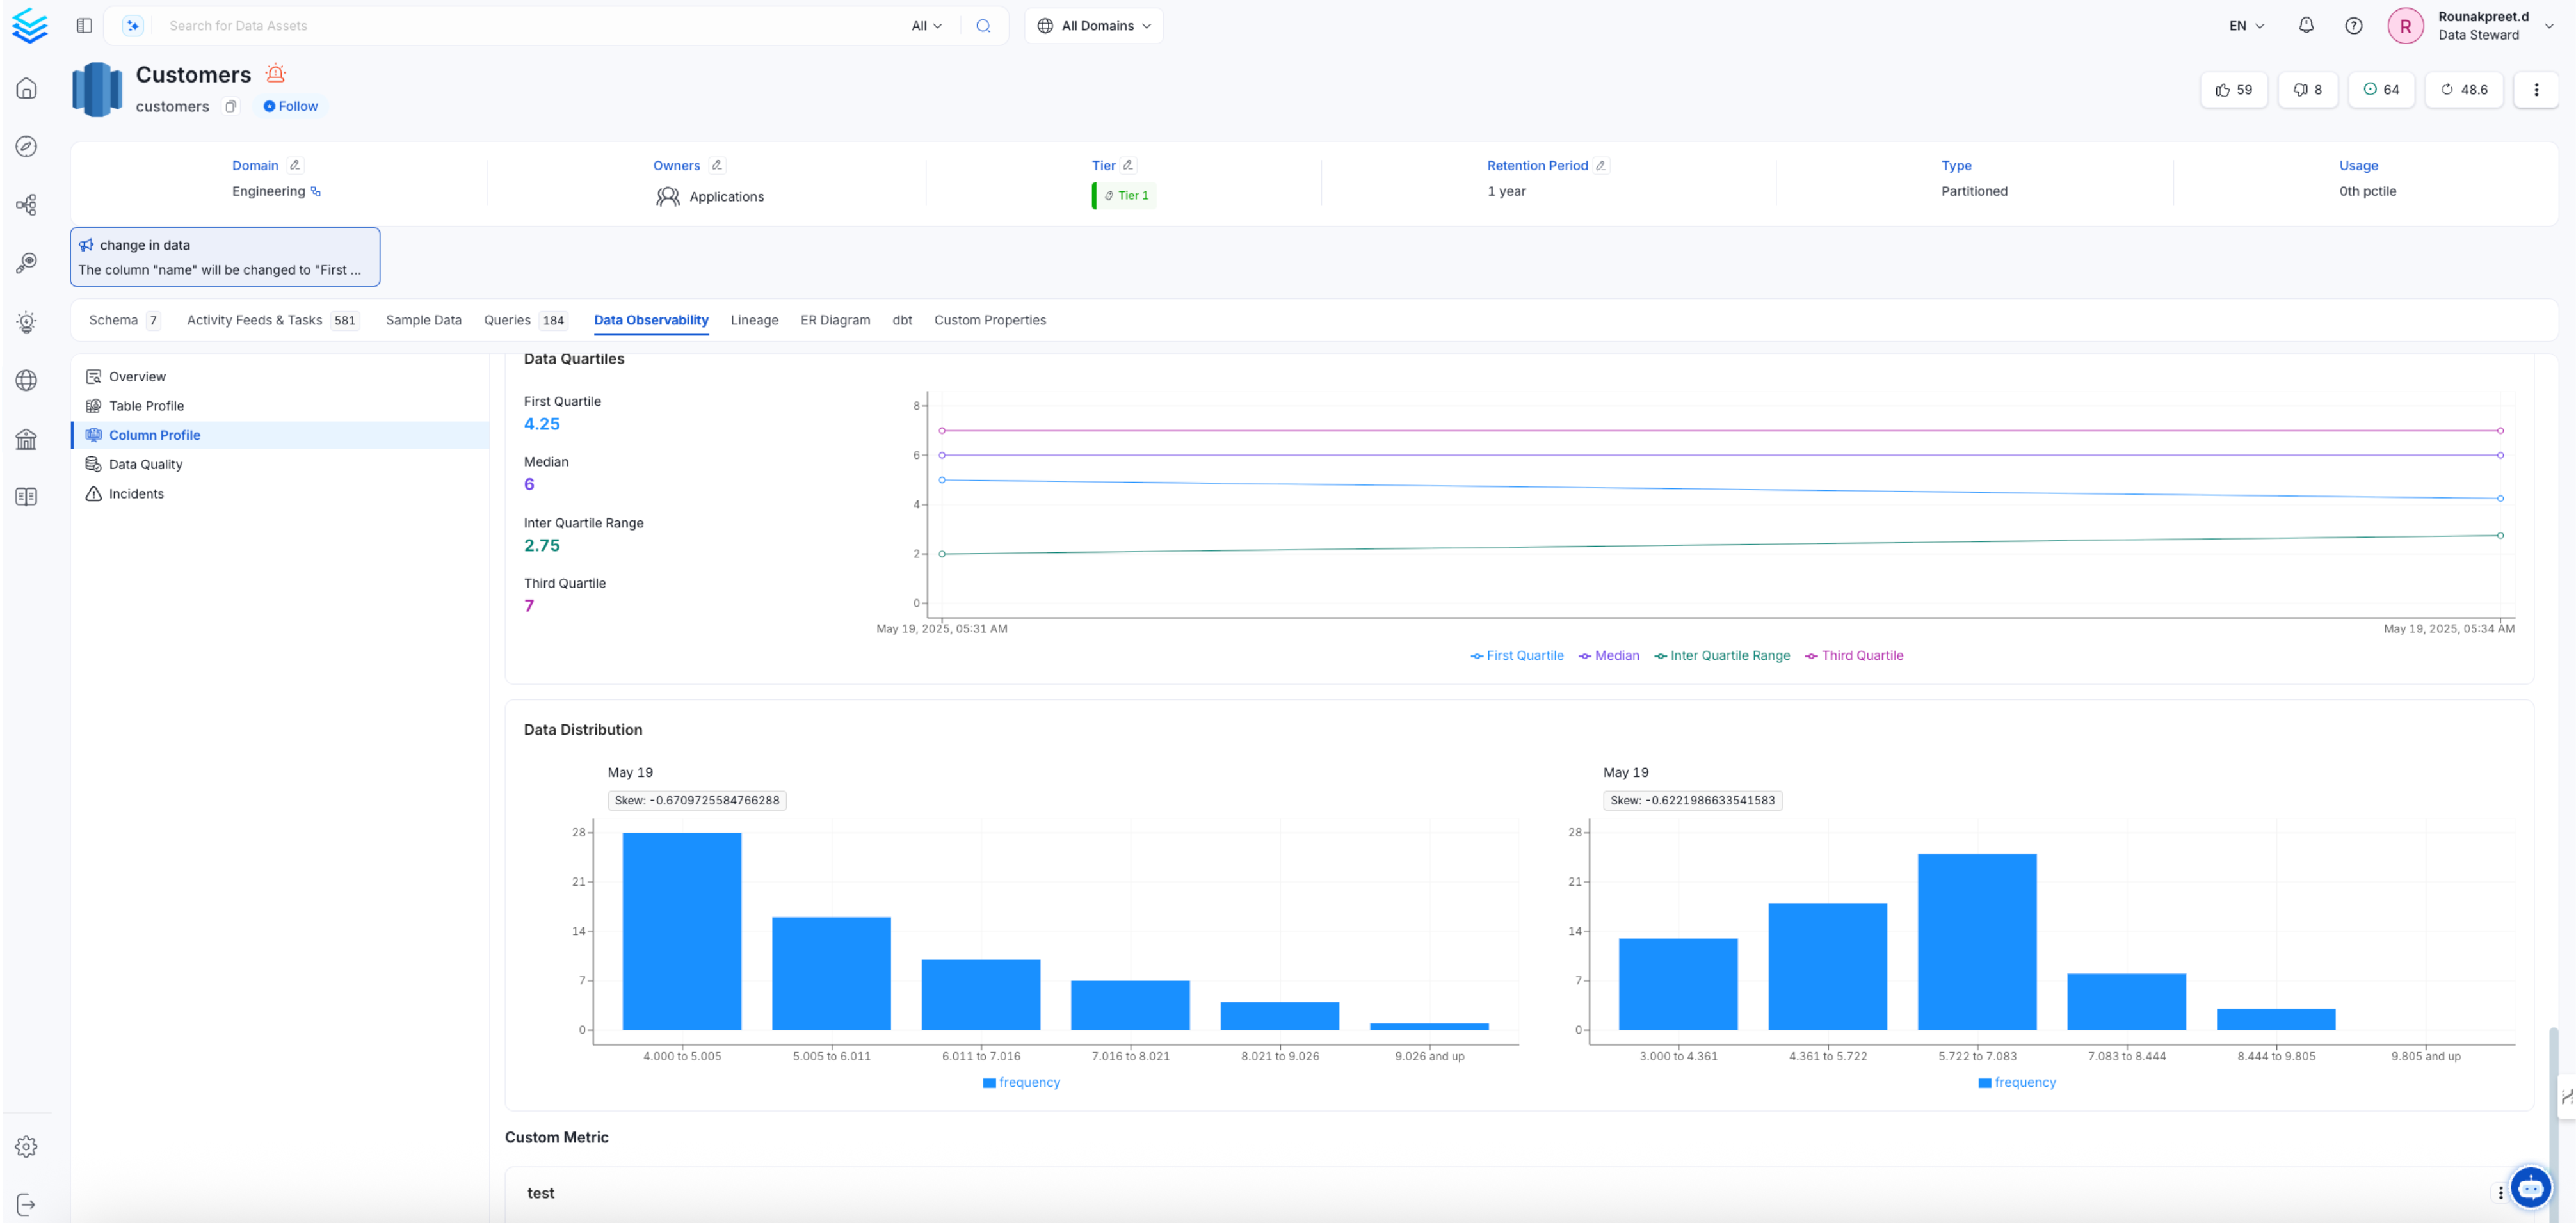
- Navigate to the Database and switch to the Data Observability tab. Click on Column Profile, and on the right-hand side, select the Add option to access the custom metric feature.
- In the Add Column metric drawer on the right side of the page, provide a Name, select the Column, and define the SQL Query, then click Create. The active column is preselected. The new metric’s graph appears without a page reload, and you land on that column’s profile.
- Save and run the profiler workflow to generate the metric.

- After running the profiler agent, return to the same dataset to view the computed custom metric within the column profile.
Custom Metric Drawer
The same drawer is used to add and edit custom metrics. It shows a profile preview beside the form: the table profile charts for a table metric, or the profile of the selected column for a column metric.- Show Hint: A toggle in the drawer header, on by default. Turn it off to hide the profile preview panel. The form then takes the full width of a narrower drawer.
Edit a Custom Metric
Use the following steps to edit an existing custom metric.- In the Table Profile or Column Profile tab, find the custom metric’s graph.
- Open the menu on the graph and select Edit. The drawer opens with the title Edit <name>.
- Update the SQL query and click Save. The Name and Column fields are locked and can’t be changed.