
Create Quality Test Cases
Run data quality tests at the table, column, and dimension level across all supported database connectors. Tests range from business validations, which confirm data meets real-world expectations, to technical checks such as ensuring required columns are never null and identifier columns hold only unique values. You don’t need a YAML or JSON config file. Set up everything from the UI by choosing a test level, filling in the details, and creating the test. Before you start, make sure you have permission to create tests on the table.How to Create a Test
- Go to the table you want to test and click the Data Observability tab.
-
Click Add Test.
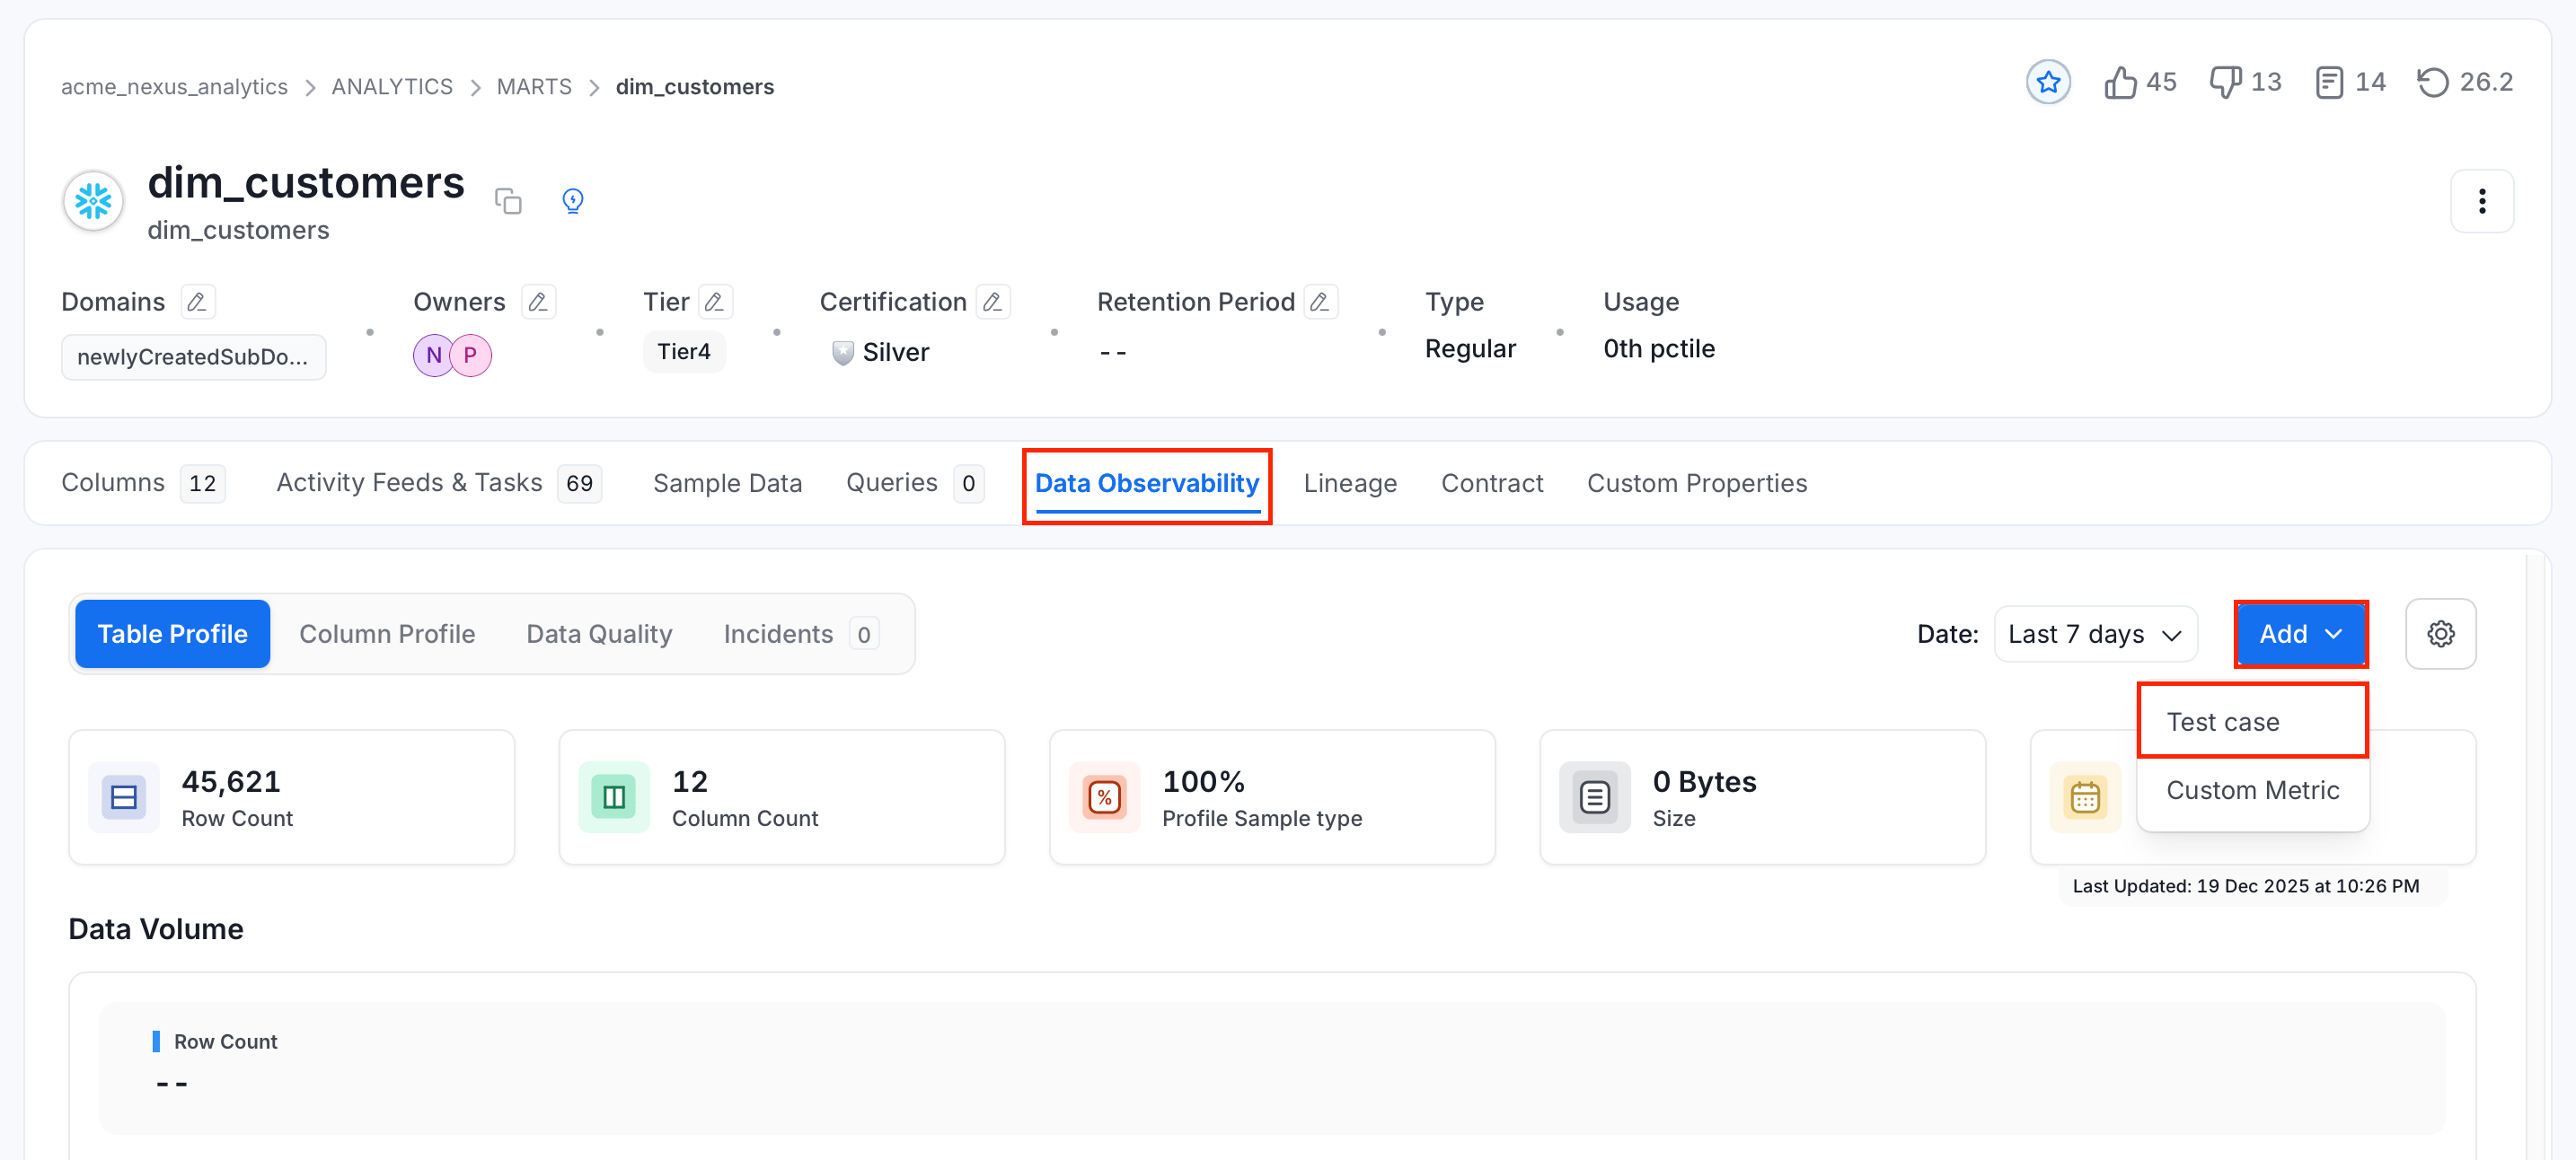
- Select a Table, Column, or Dimension level test.
- Enter the test details. See Table Level Test, Column Level Test, and Dimension Level Test for the fields of each level.
- Click Create to save the test.
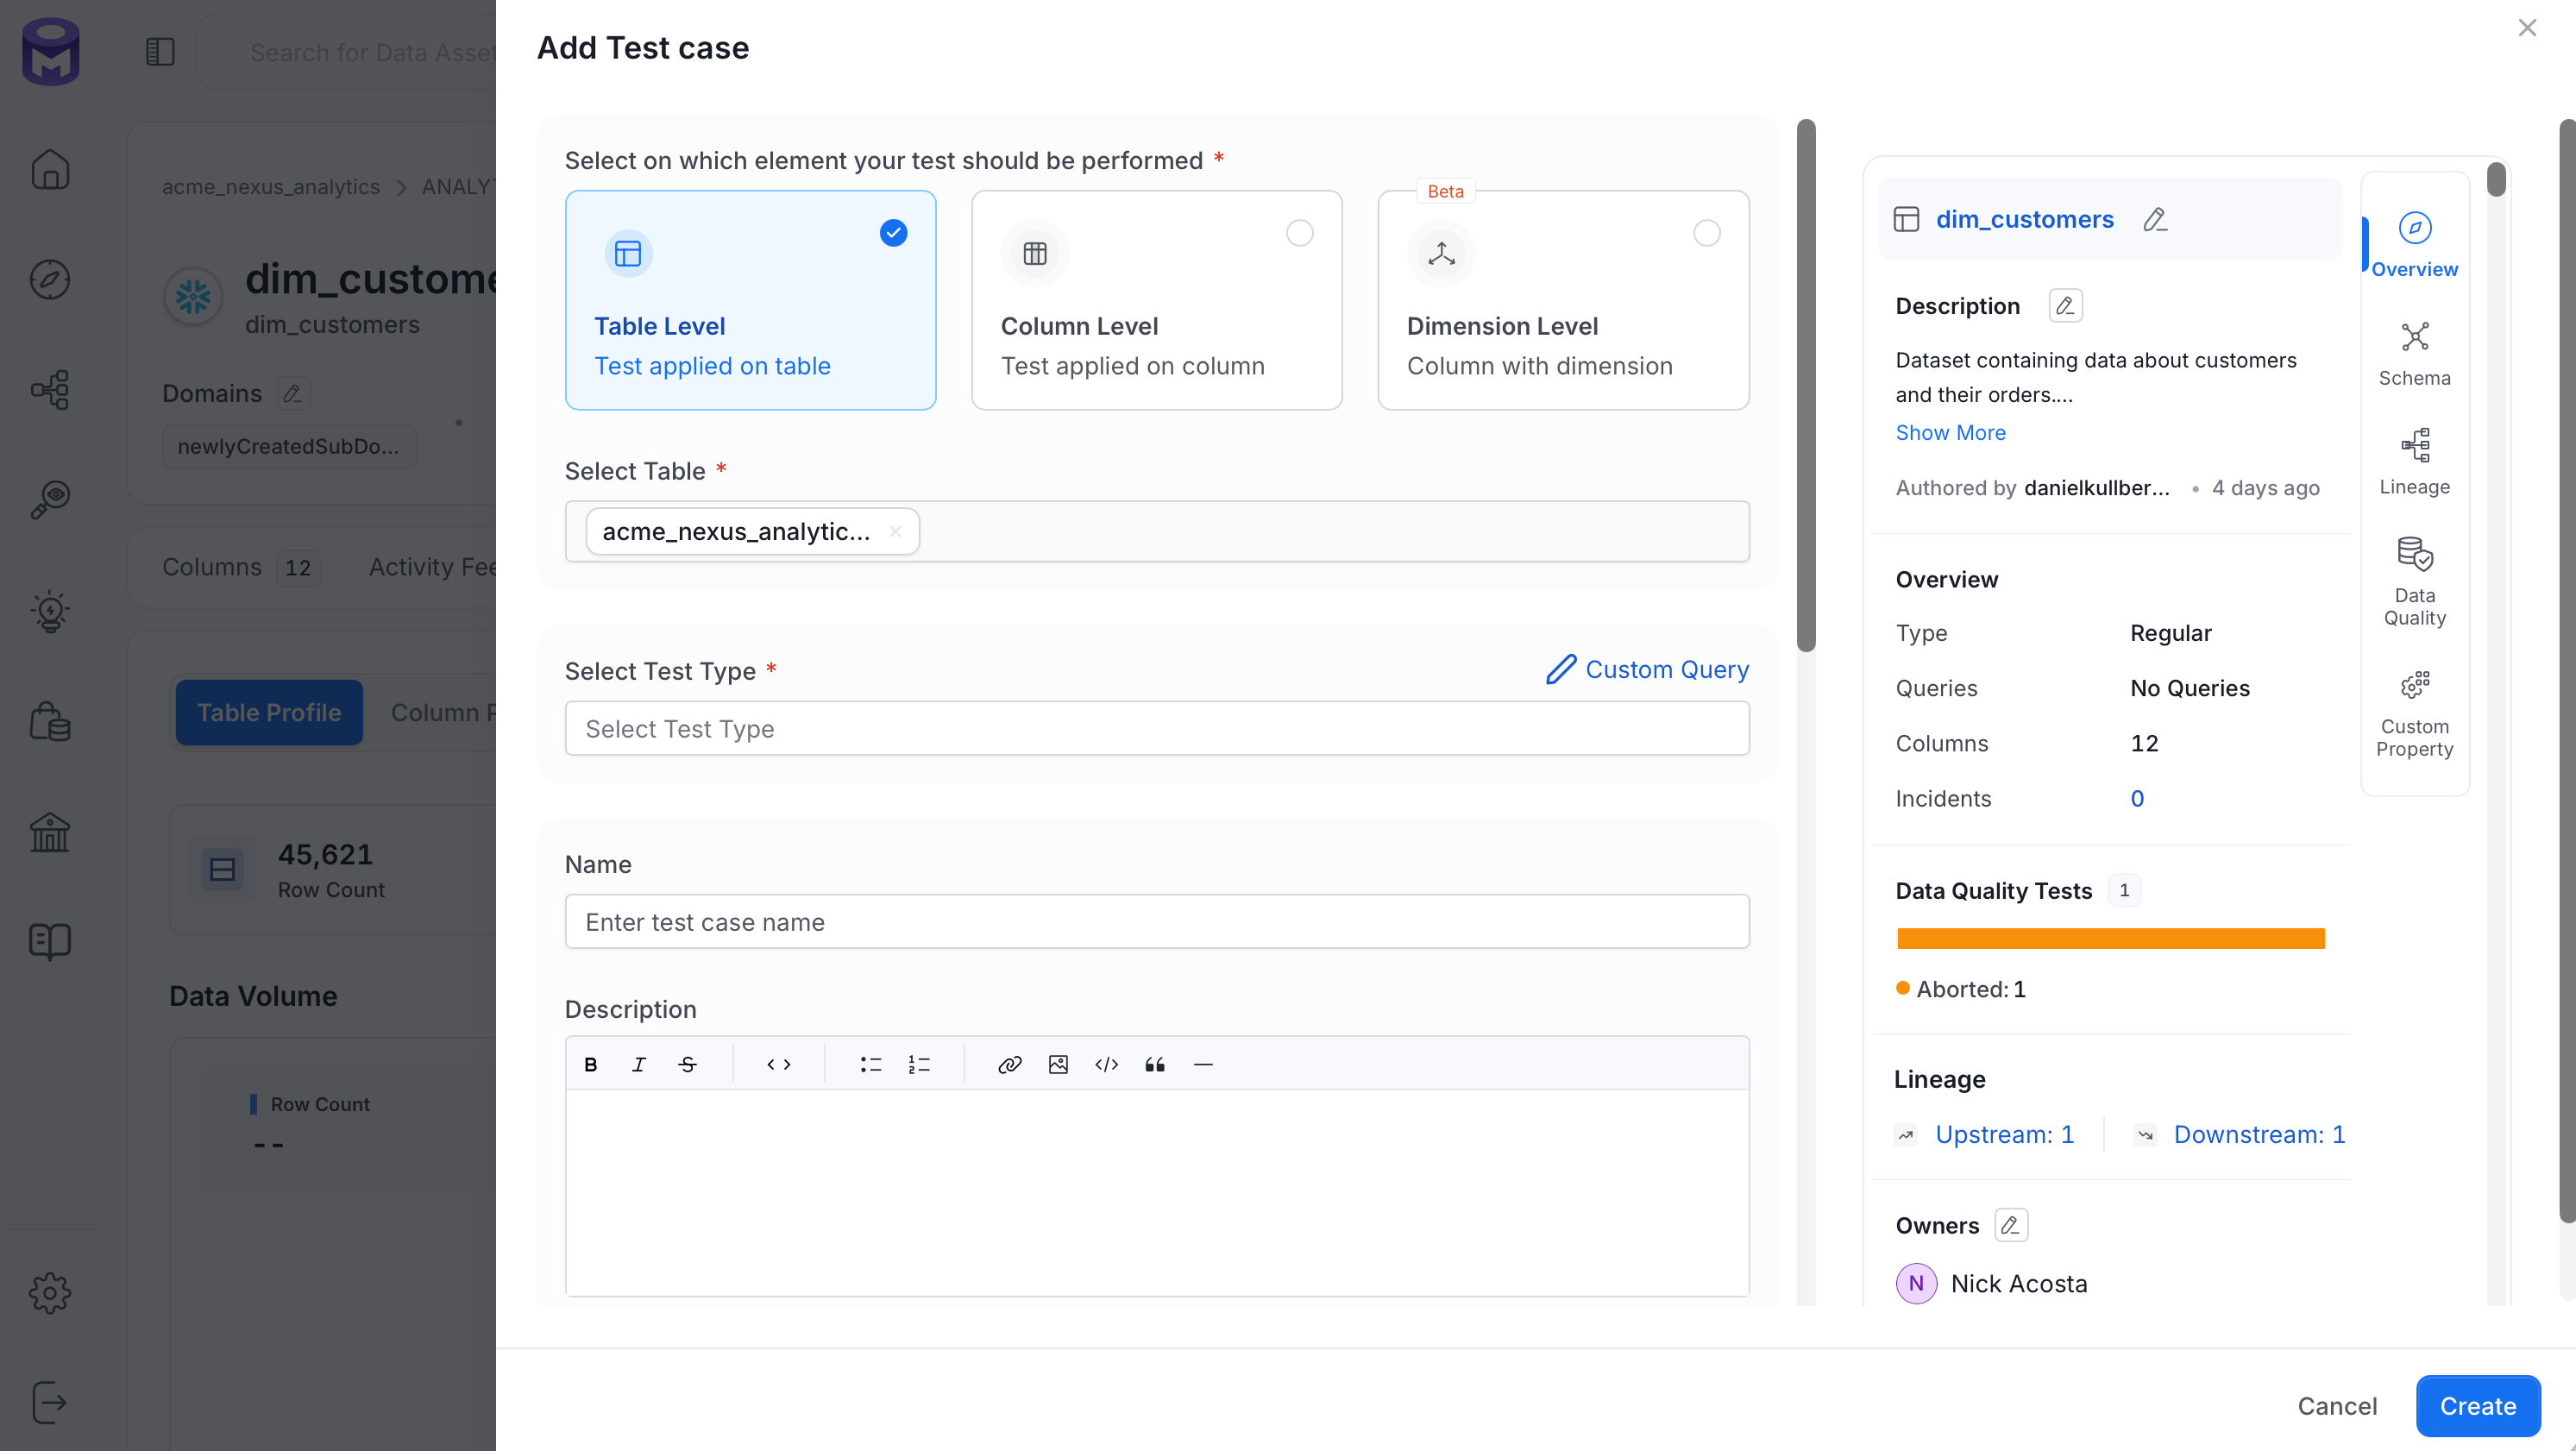
Table Level Test
A Table Level Test validates properties of the whole table, such as row counts or column structure. It can also check insert freshness or custom SQL logic. Enter the following details:- Name: A name that describes your test case.
- Test Type: The validation to run. The fields below it depend on the test type.
- Description: What the test validates.
- Table Column Count to be Between: Define the Min. and Max.
- Table Column Count to Equal: Define a number.
- Table Column Name to Exist: Define a column name.
- Table Column Names to Match Set: Add comma separated column names to match. Also verify whether the column names are in order.
- Custom SQL Query: Define a SQL expression. Select a strategy if it should apply for Rows or for Count. Define a threshold to determine if the test passes or fails.
- Table Row Count to be Between: Define the Min. and Max.
- Table Row Count to Equal: Define a number.
- Table Row Inserted Count to be Between: Define the Min. and Max. row count. This test will work for columns whose values are of the type Timestamp, Date, and Date Time field. Specify the range type in terms of Hour, Day, Month, or Year. Define the interval based on the range type selected.
- Compare 2 Tables for Differences: Compare 2 tables for differences. Checks integrity between the two tables.
Column Level Test
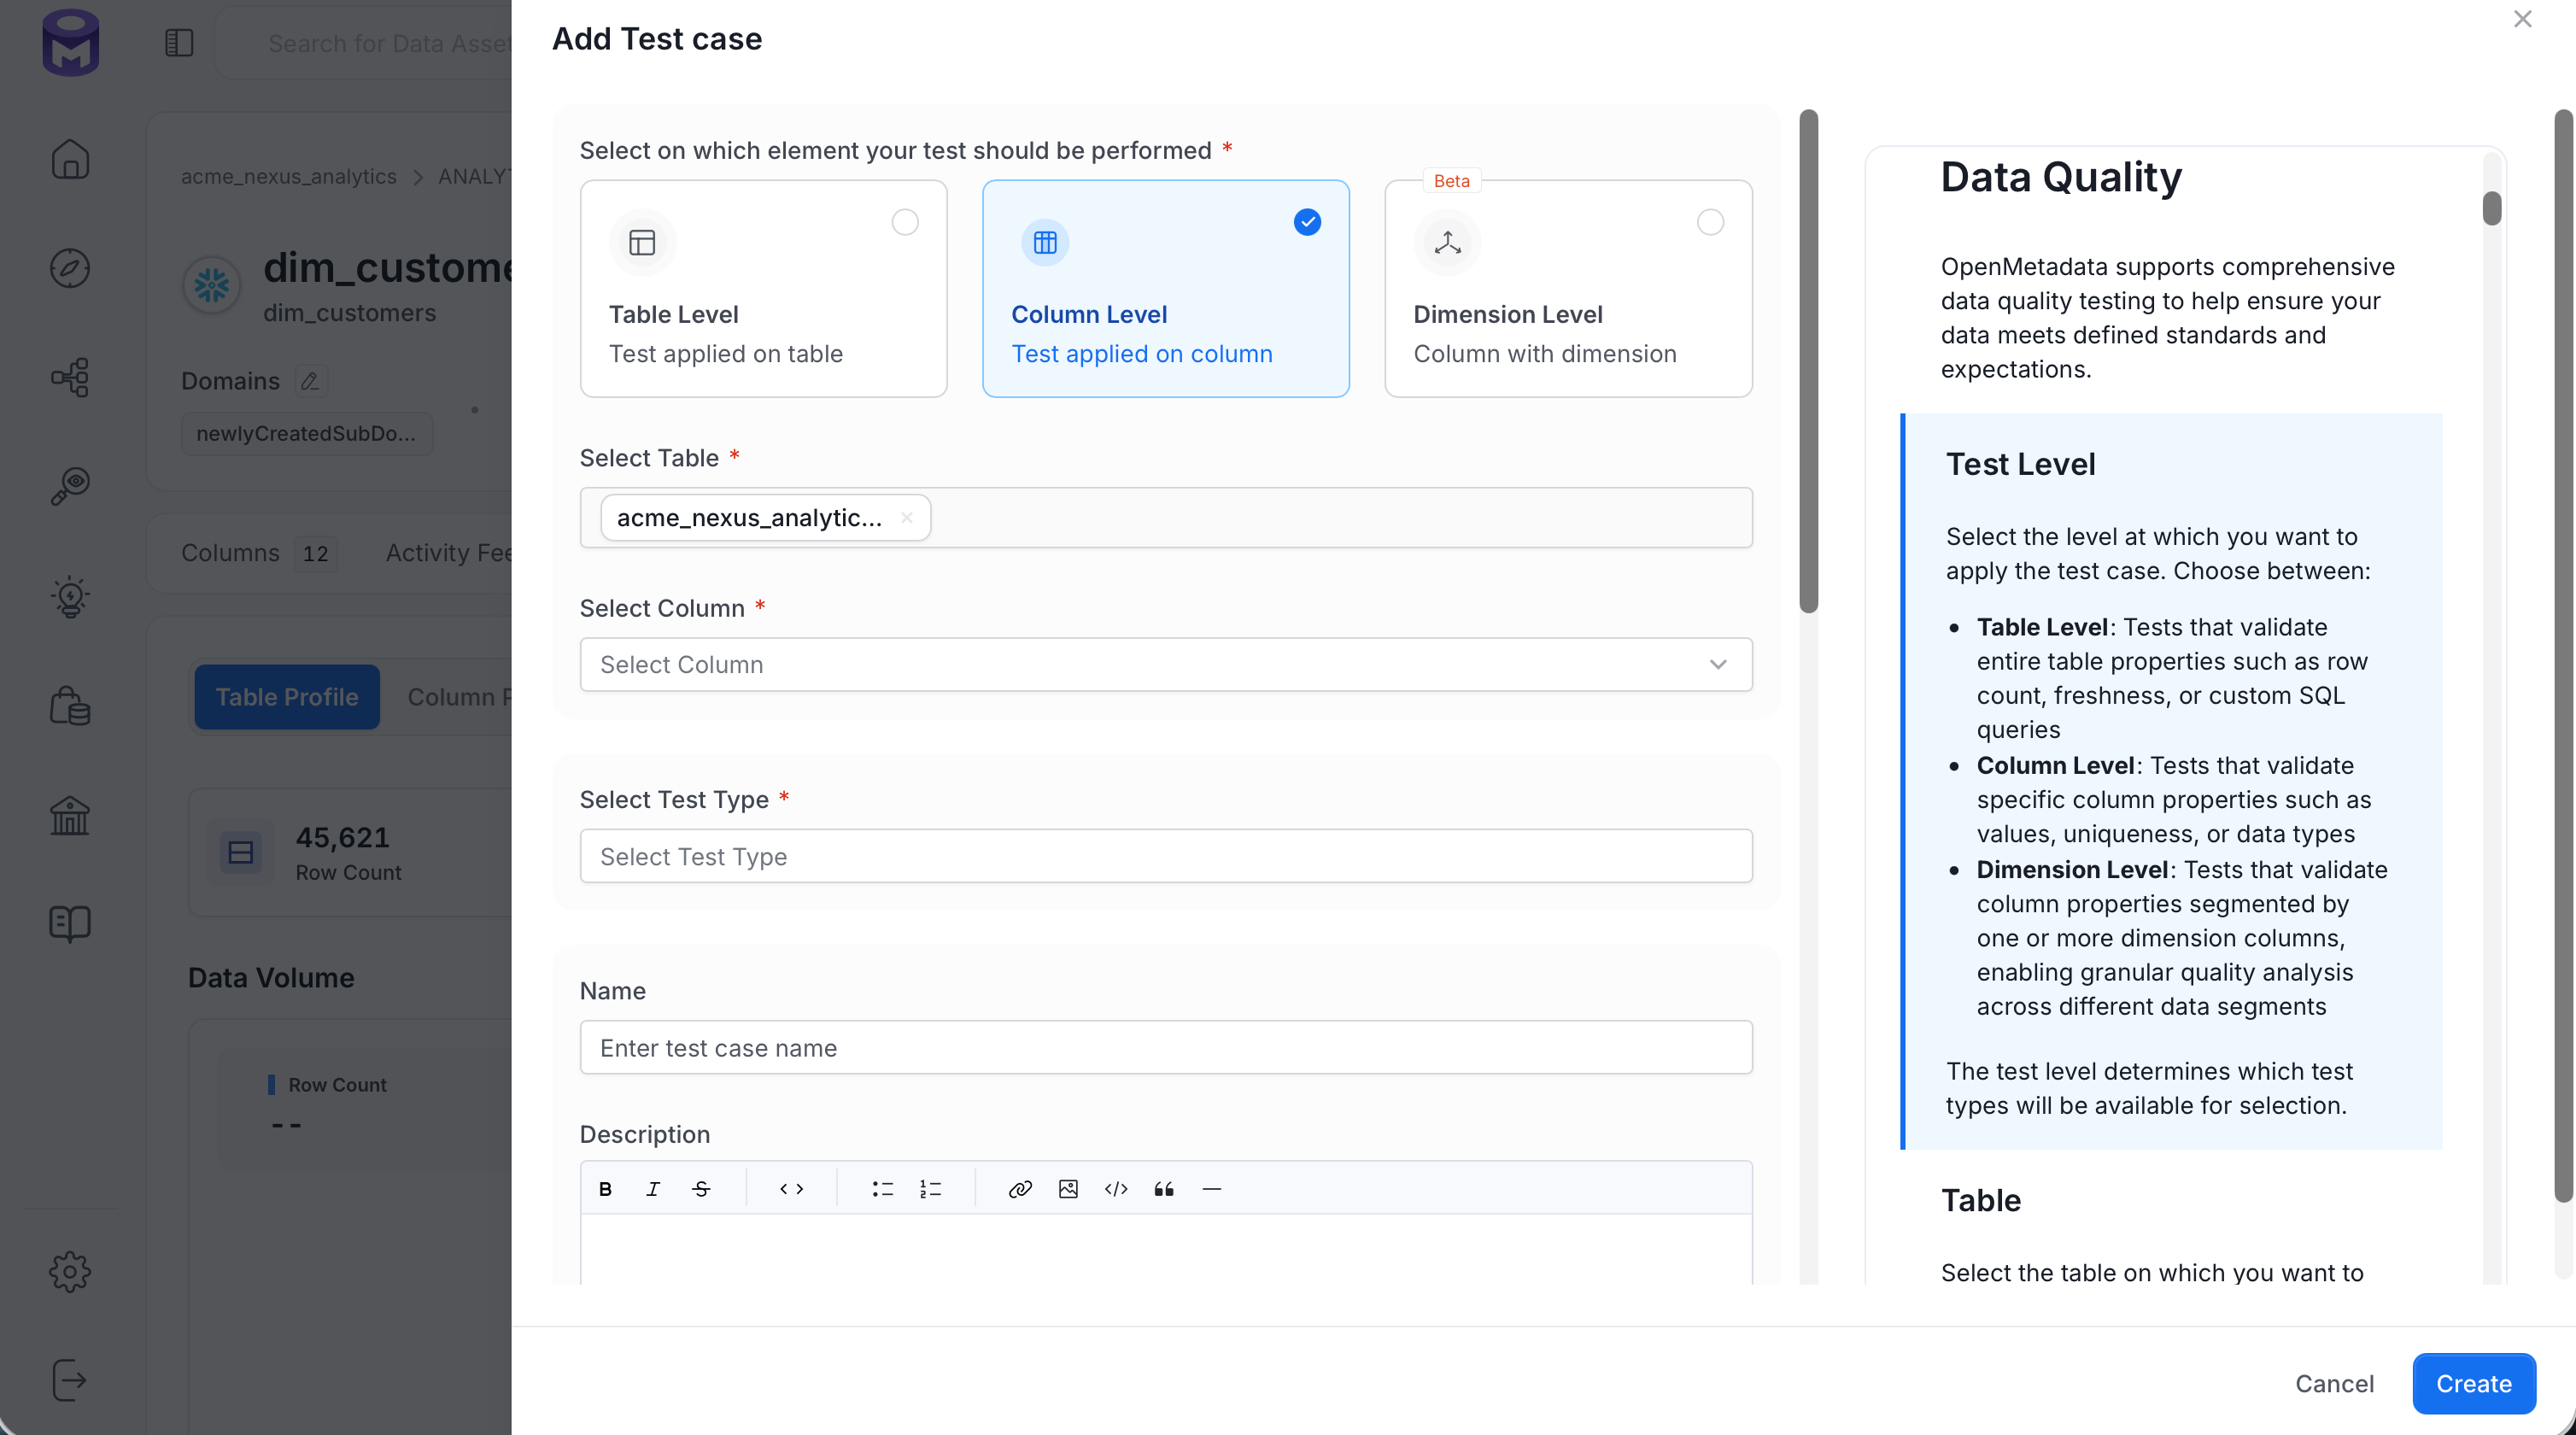
A Column Level Test validates the values of one column, such as null counts or value ranges. It can also check uniqueness and pattern matching. Enter the following details:- Column: The column to test. A summary of the column appears next to the form.
- Name: A name that describes your test case.
- Test Type: The validation to run. The fields below it depend on the test type.
- Description: What the test validates.
- Column Value Lengths to be Between: Define the Min. and Max.
- Column Value Max. to be Between: Define the Min. and Max.
- Column Value Mean to be Between: Define the Min. and Max.
- Column Value Median to be Between: Define the Min. and Max.
- Column Value Min. to be Between: Define the Min. and Max.
- Column Values Missing Count: Define the number of missing values. Also match all null and empty values as missing. Also configure additional missing strings like N/A.
- Column Values Sum to be Between: Define the Min. and Max.
- Column Value Std Dev to be Between: Define the Min. and Max.
- Column Values to be Between: Define the Min. and Max.
- Column Values to be in Set: Add an array of allowed values.
- Column Values to be Not in Set: Add an array of forbidden values.
- Column Values to be Not Null
- Column Values to be Unique
- Column Values to Match Regex Pattern: Define the regular expression that the column entries should match.
- Column Values to Not Match Regex: Define the regular expression that the column entries should not match.
- Column Values To Be At Expected Location: Define a geographic area, such as a radius around an expected location, that latitude and longitude values must fall within.
Set a Failure Threshold (Optional)
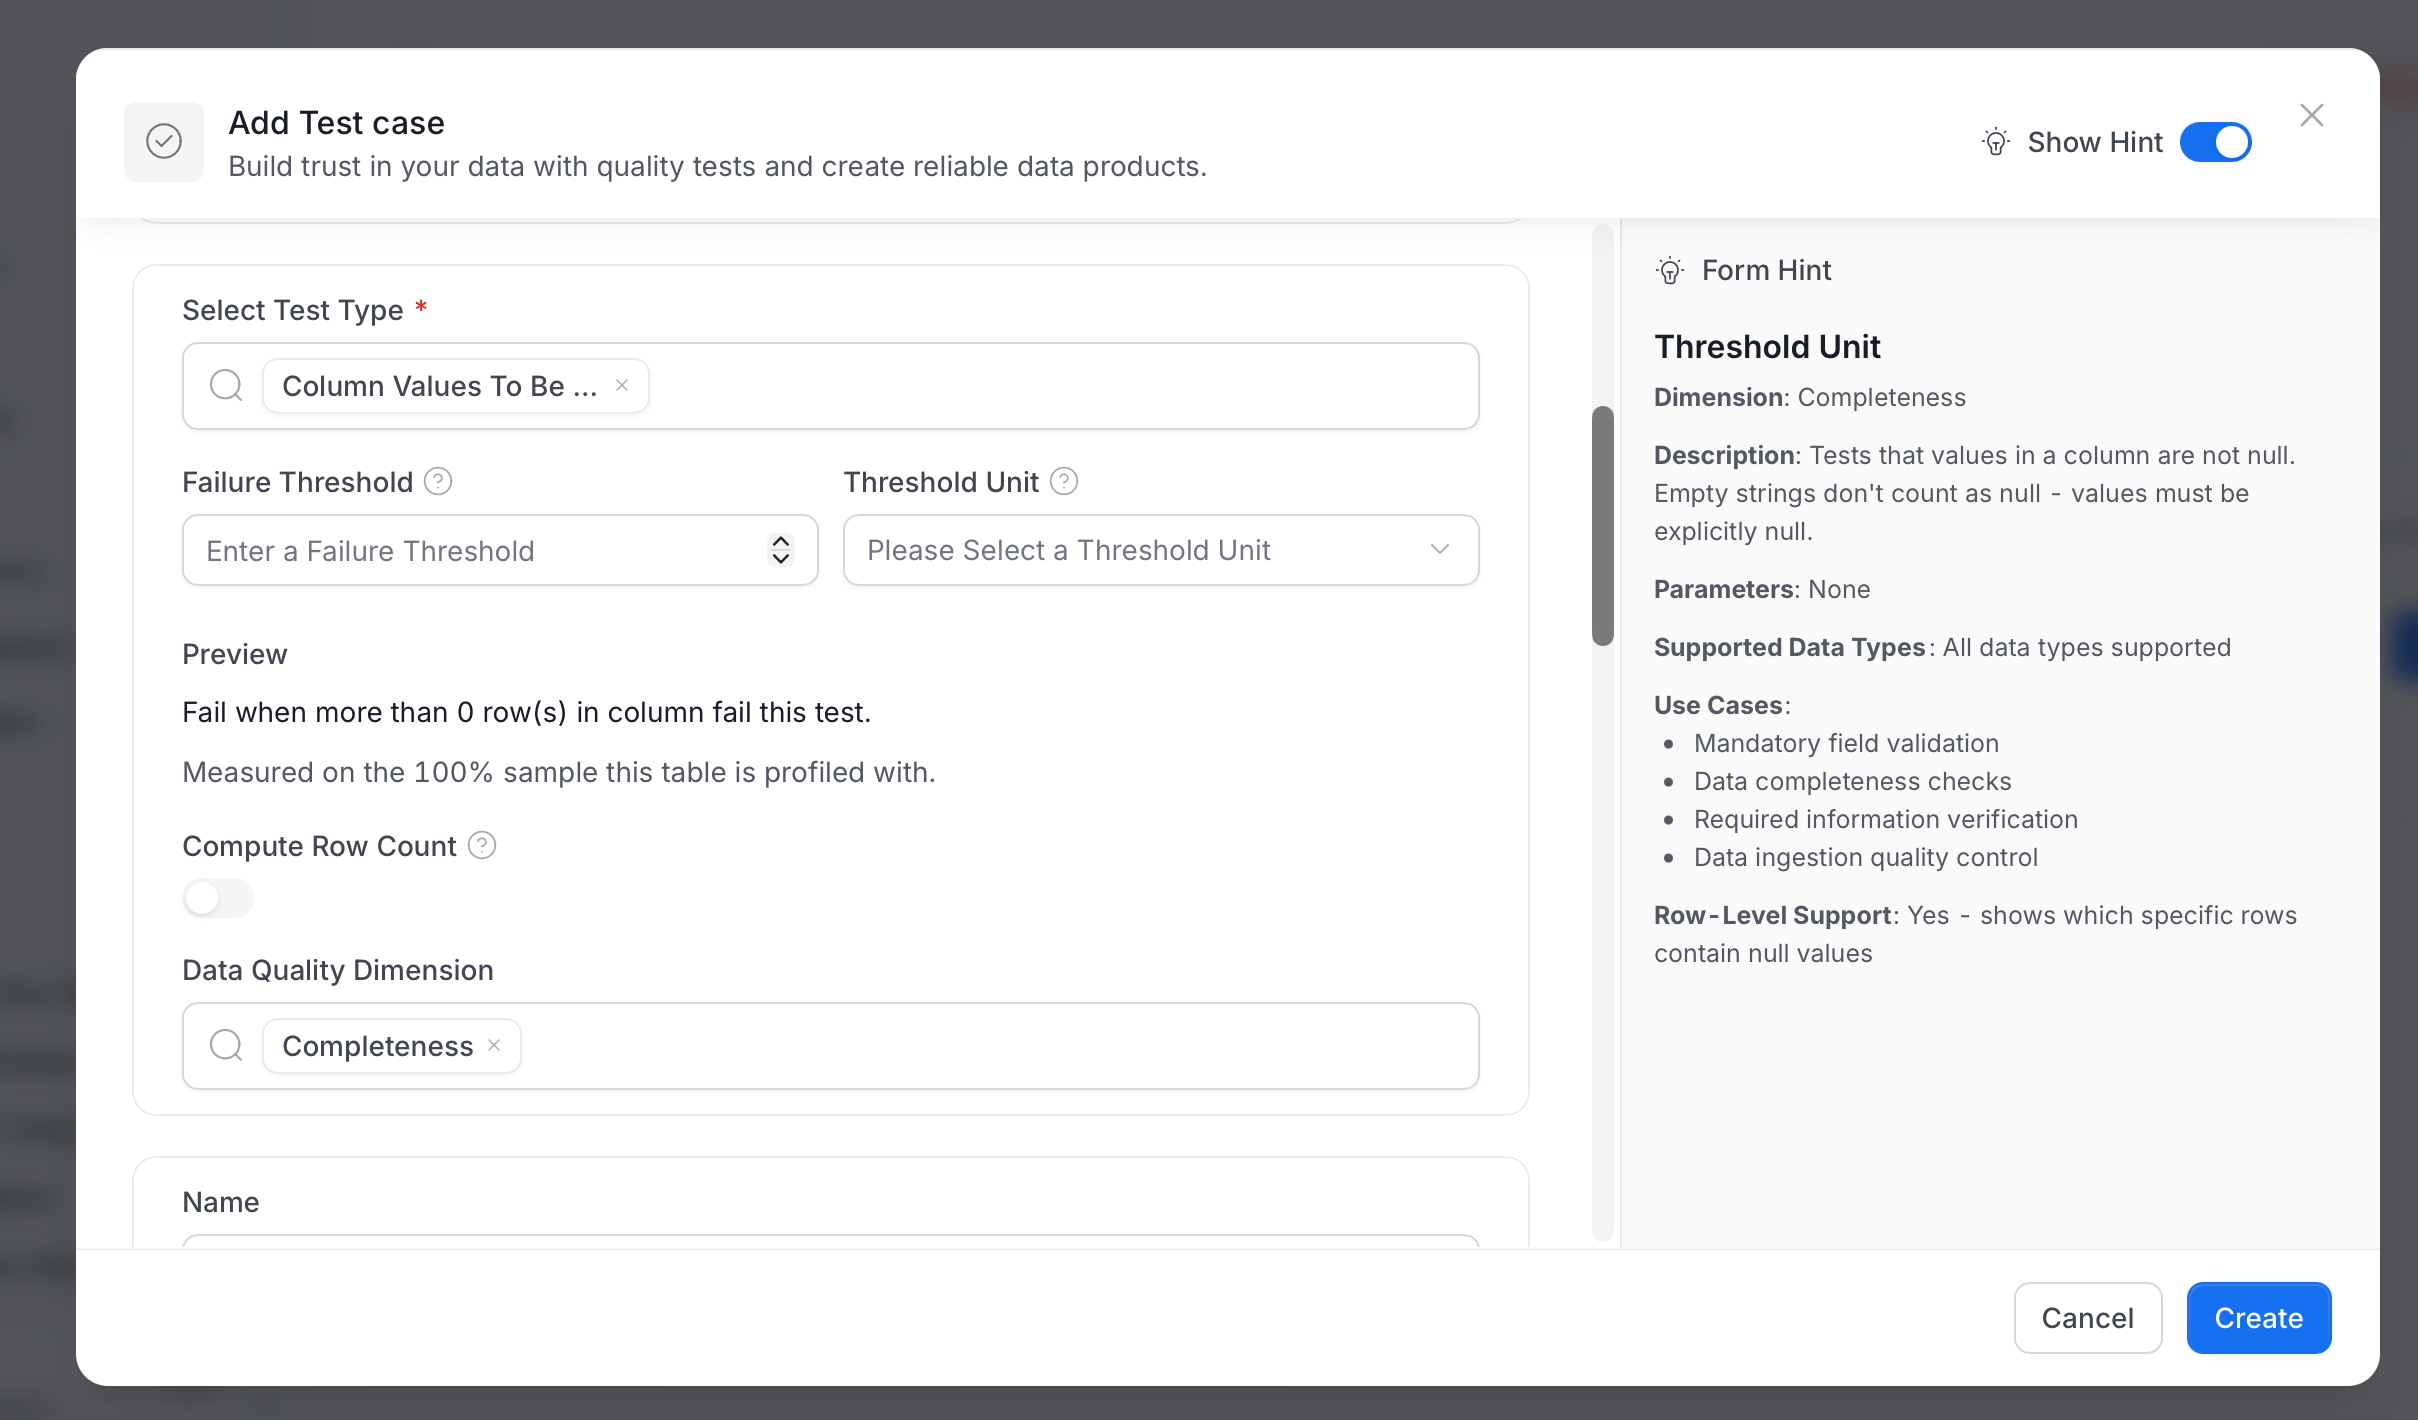
Many test definitions let you choose how many failures to tolerate before the test is marked as failed. By default no failures are tolerated, so a single failing row fails the test. The form shows Failure Threshold and Threshold Unit fields for the tests listed in Tests That Support a Failure Threshold.- In Select Test Type, pick a test, for example Column Values To Be Not Null.
-
In Failure Threshold, enter the number of failures to tolerate. It can’t be negative.
-
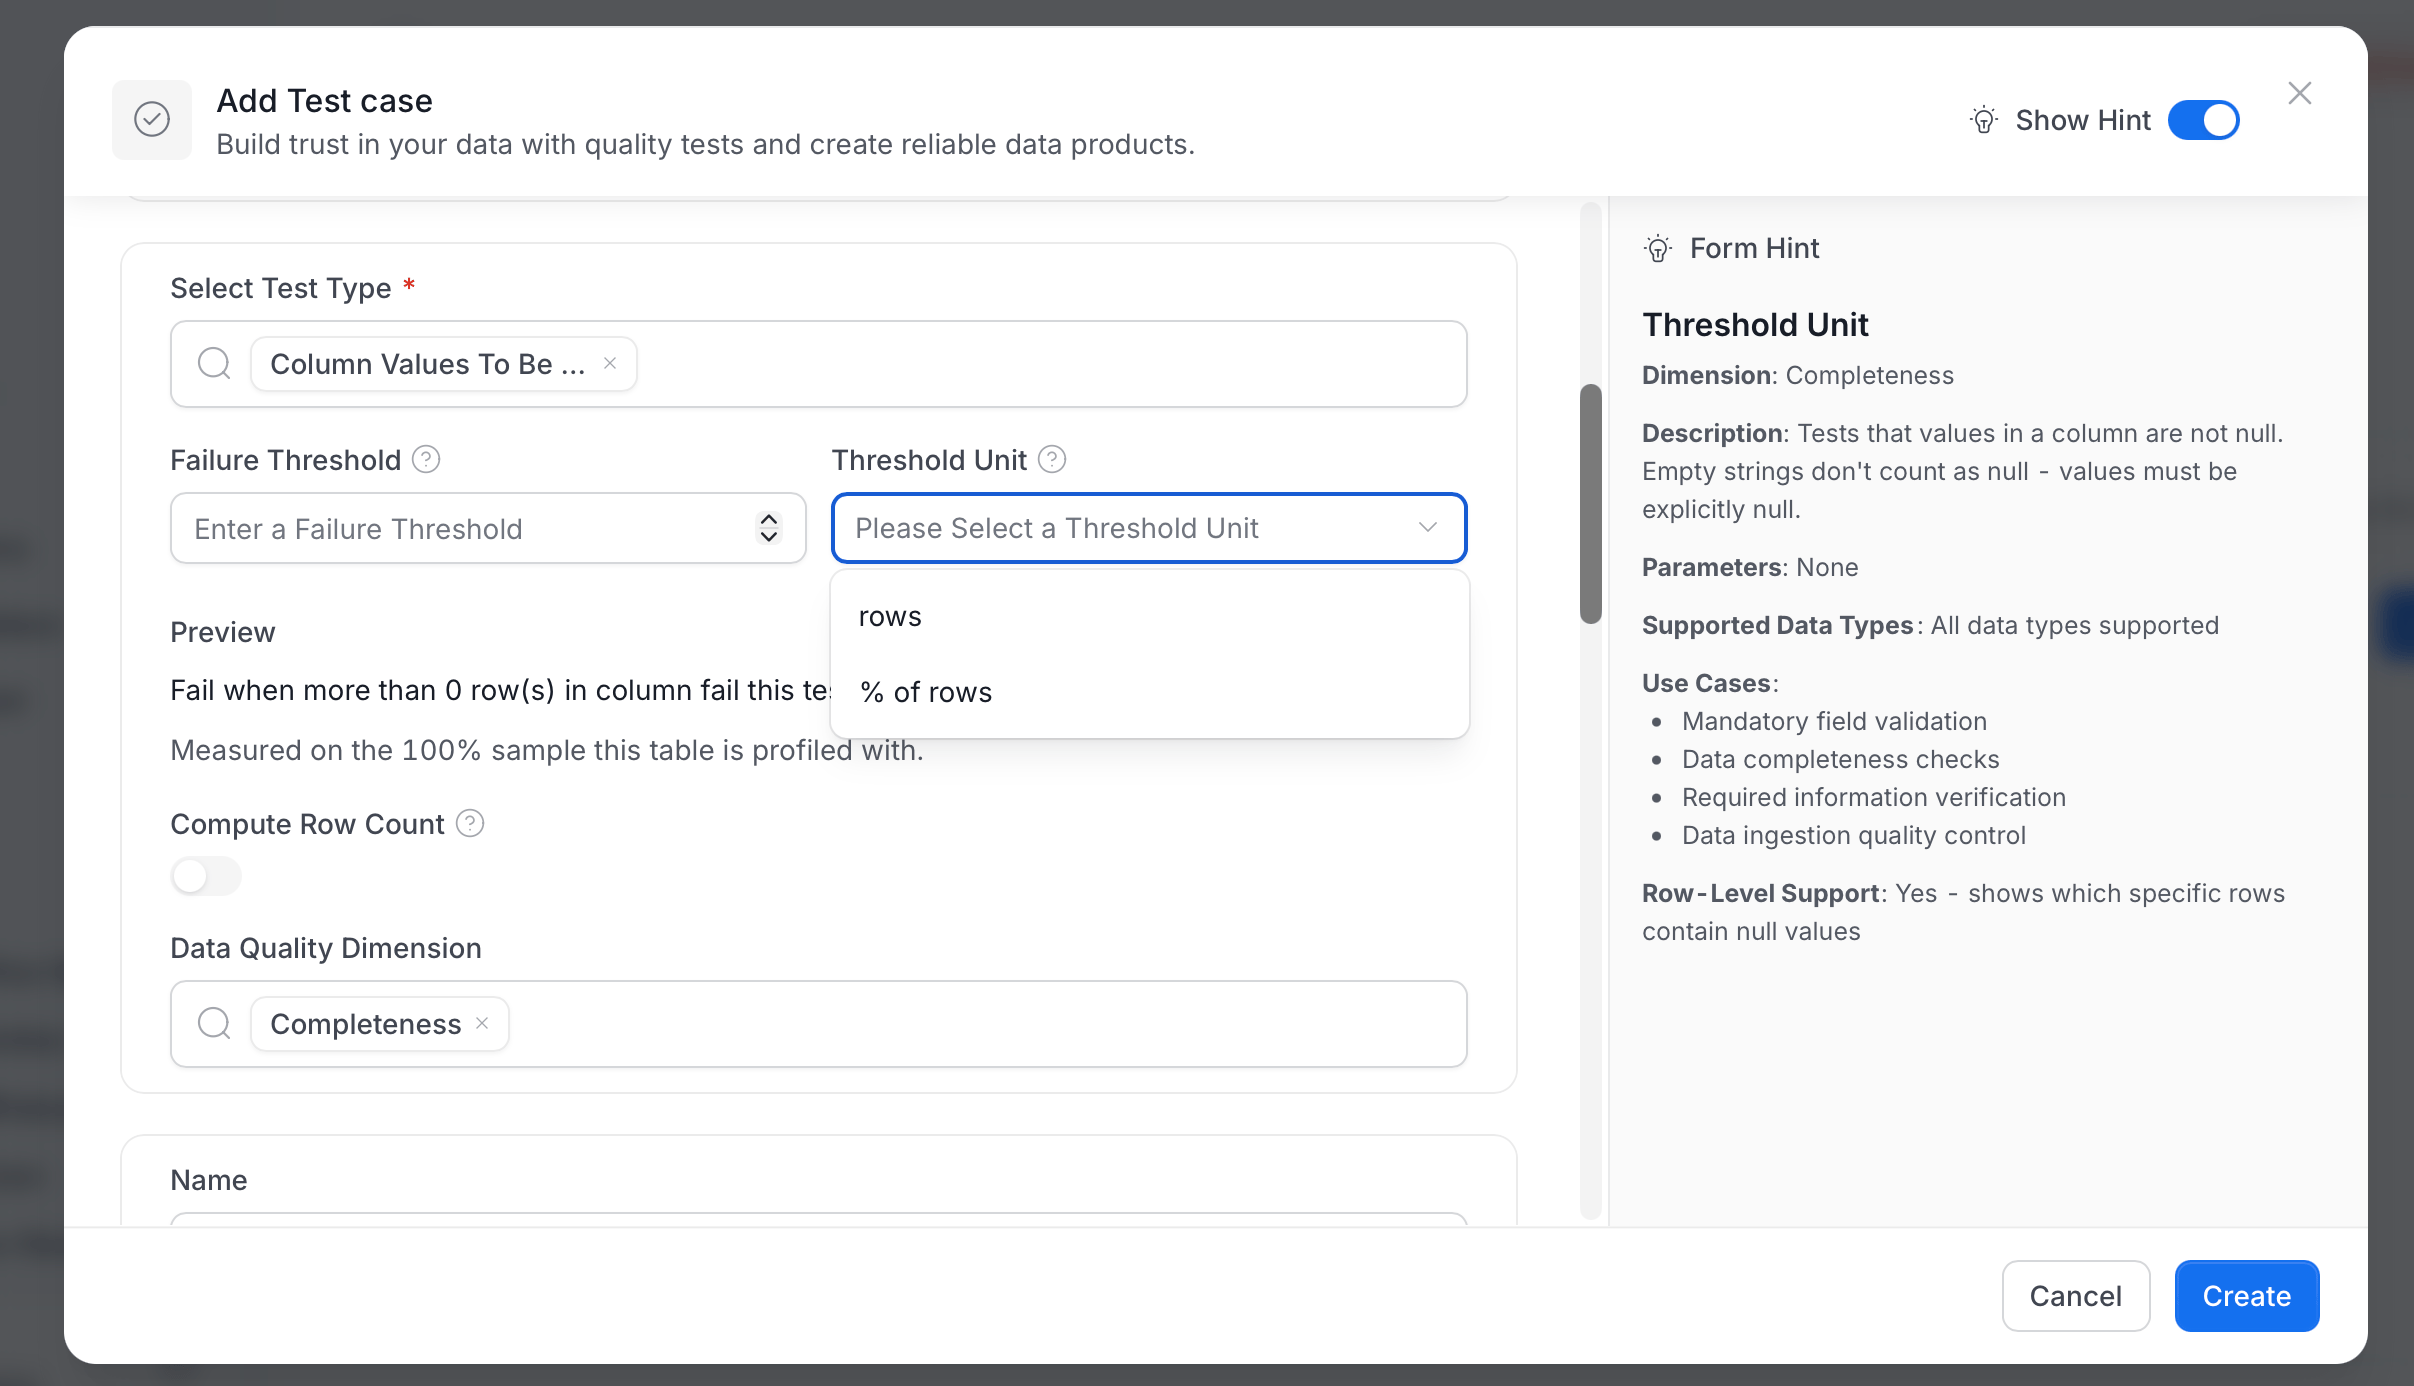
In Threshold Unit, choose how the threshold is measured:
- rows: a count of failing rows. In the API this is
ABSOLUTE. - % of rows: a share of the rows evaluated. For row-level tests the value can’t be higher than 100. In the API this is
PERCENTAGE.
- rows: a count of failing rows. In the API this is
- Check the Preview. It restates your choice, for example “Fail when more than 0 row(s) in column fail this test.” A second line shows what the check is measured on, for example “Measured on the 100% sample this table is profiled with.”
- Optional: Turn on Compute Row Count.
- Confirm the Data Quality Dimension.
- Enter a name.
- Click Create.
- Row-level tests count the rows that break the rule. They fail when that count, or its share of the evaluated rows, is above the threshold.
- Statistical tests widen the accepted bounds by the threshold, so small deviations don’t fail the test.
- Column Values to be in Set rejects a non-zero threshold when its
matchEnumoption is off, because that mode has no failing rows to tolerate. A threshold of0is always accepted. - Custom SQL Query has its own Threshold and Operator. Its threshold is a value that the query result is compared with, not a number of failures to tolerate. The form adds only a Threshold Unit field.
Tests That Support a Failure Threshold
The following tables show which tests have the threshold fields.Table Level Tests
This table shows which table level tests support the threshold fields.Column Level Tests
This table shows which column level tests support the threshold fields.
For a worked example, see Column Values to Be Not Null.
Dimension Level Test
A dimension level test is a column test whose results are split by one or more dimension columns, to show which segment of the data is failing. See Dimensional Validation for concepts, setup, and examples.View Test Results
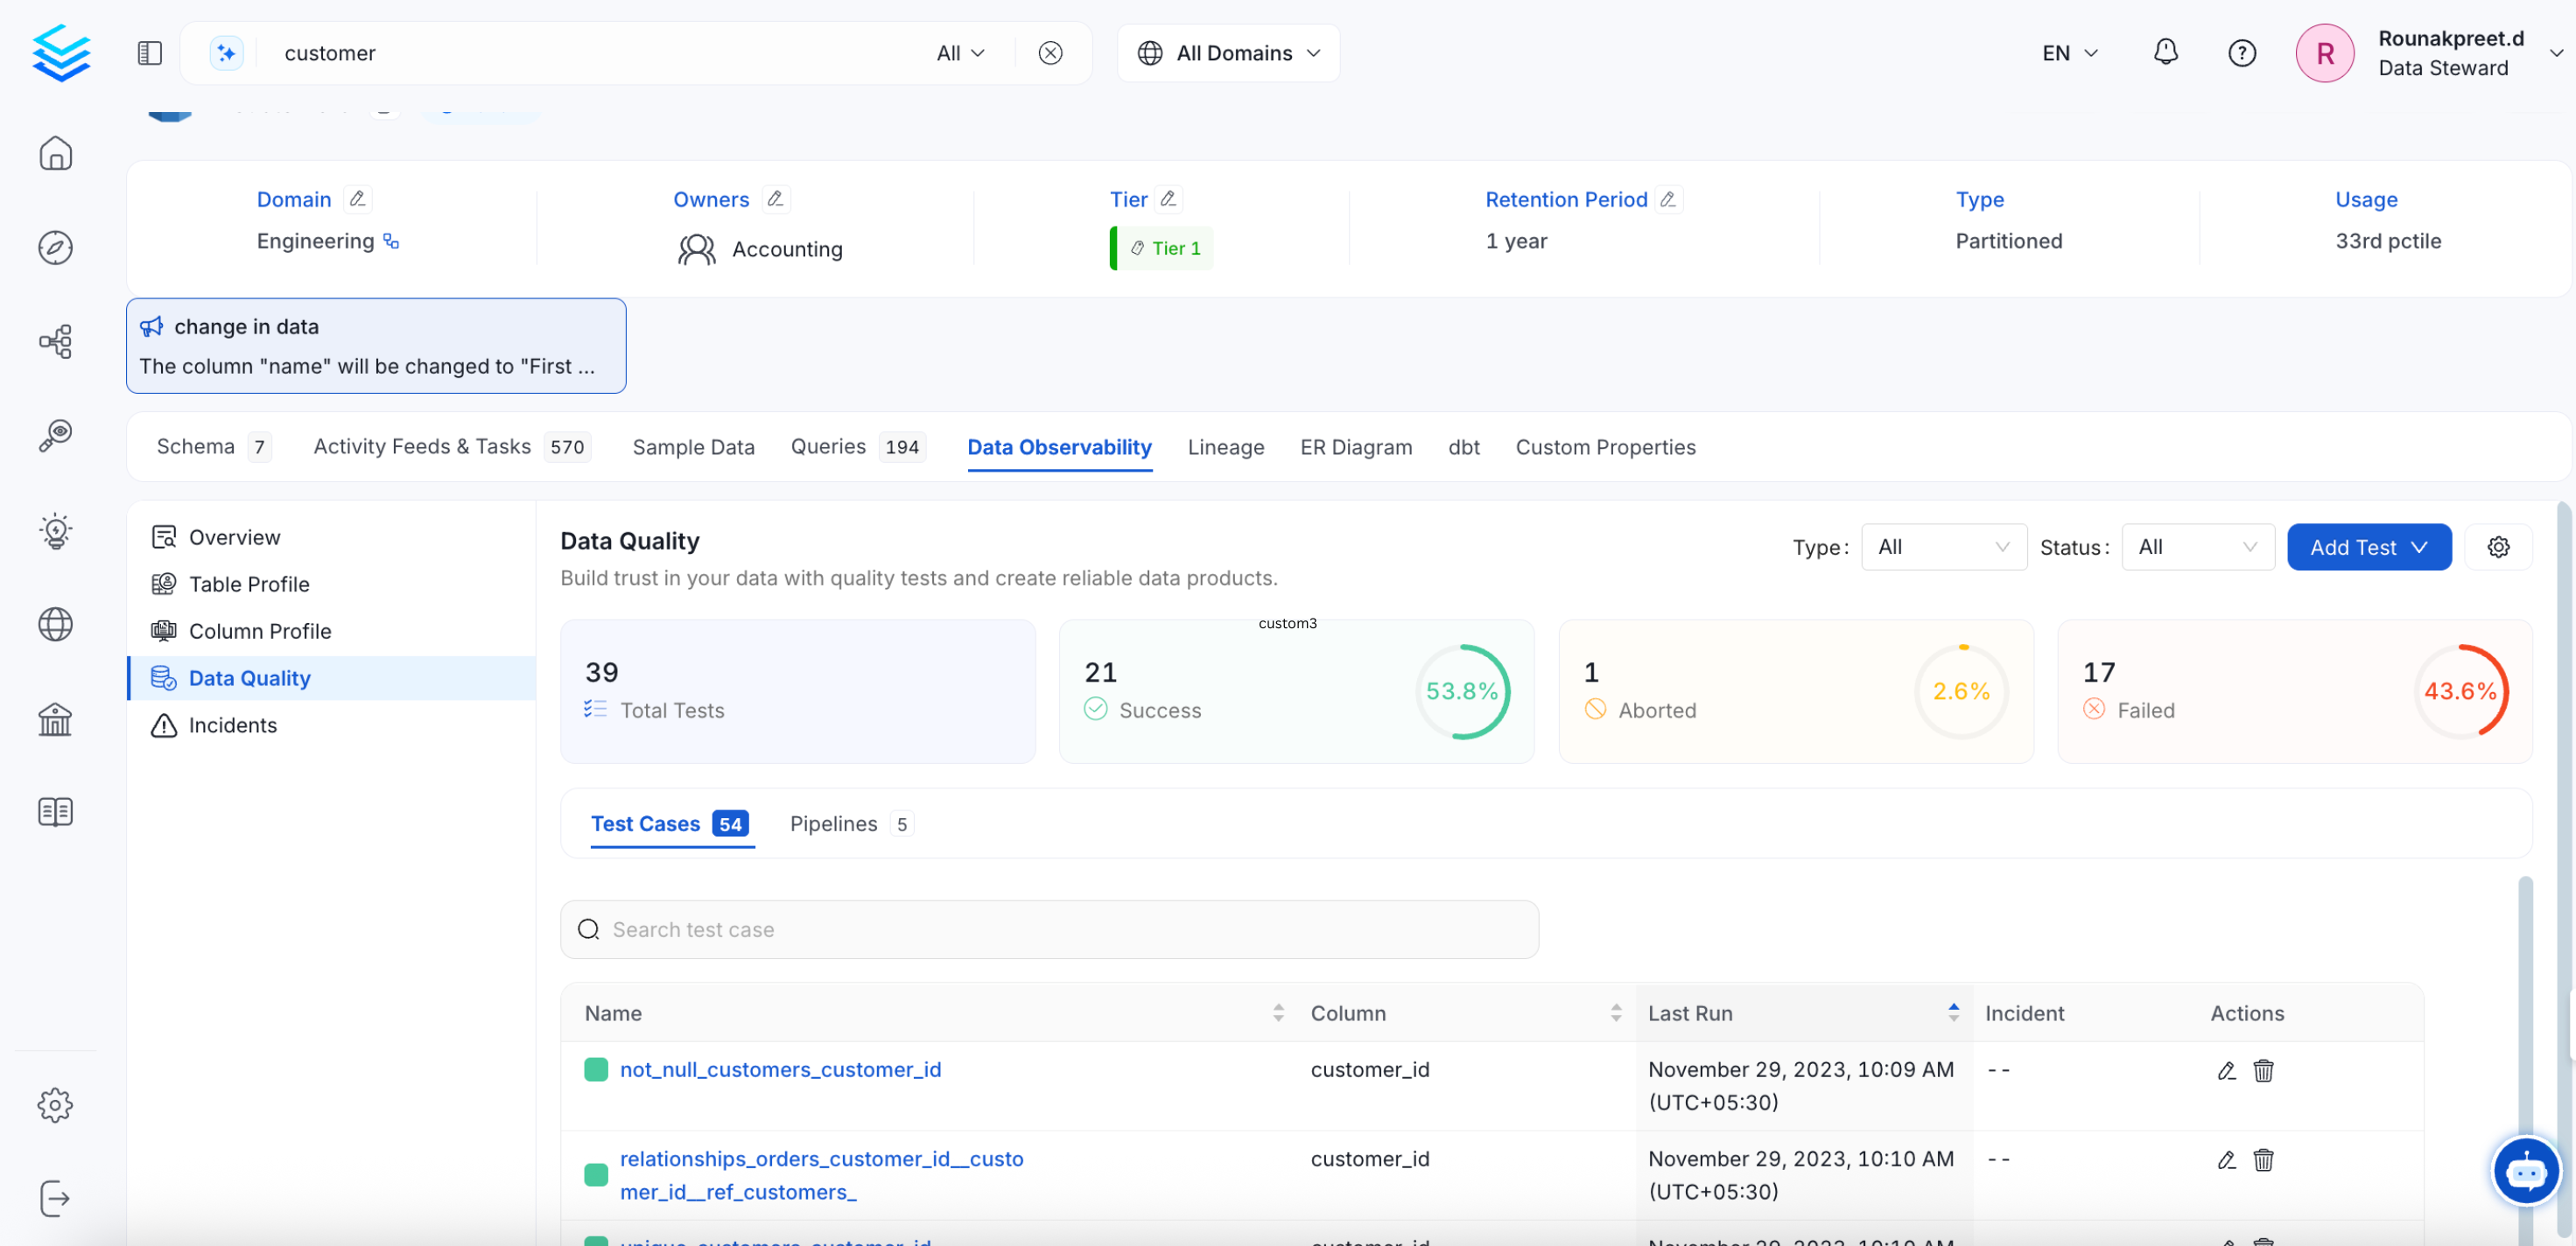
After you create a test, it appears in the Data Quality tab. Edit its display name and description there.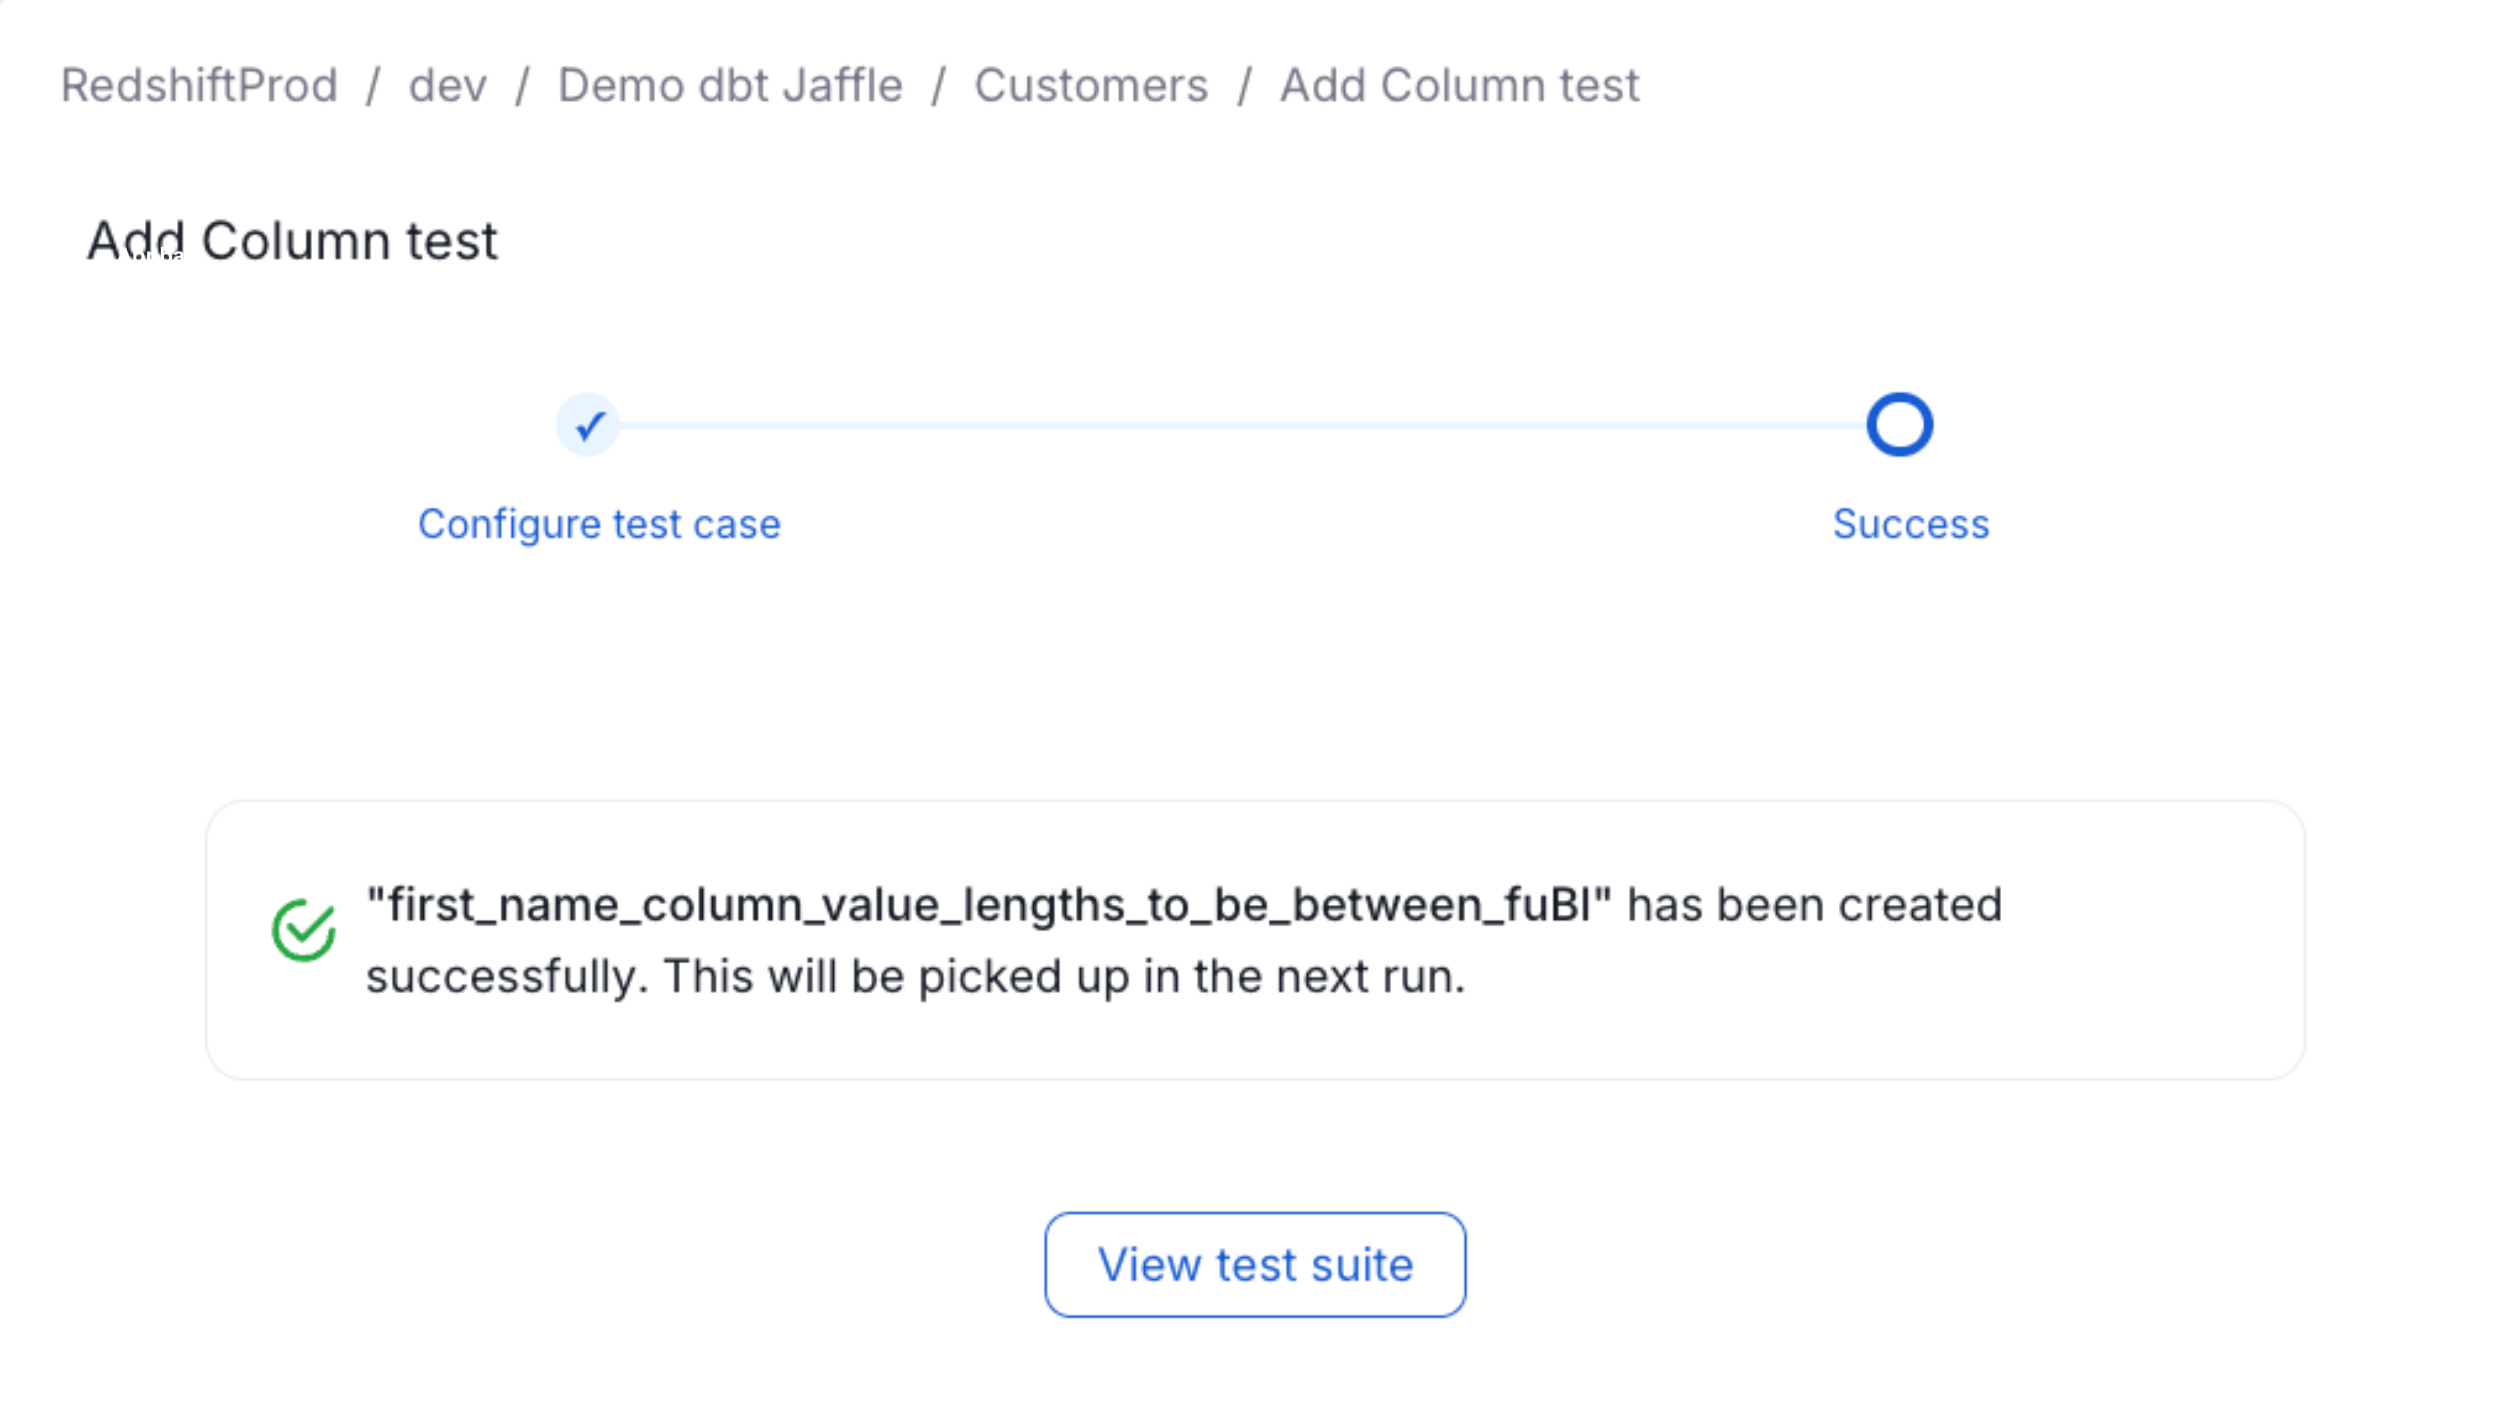
Filter Test Cases by Status
Navigate to Observability > Data Quality and select the Test Cases tab. The filter bar has Advanced, Table, Type, Status, and Tags filters. Use Clear All to reset them.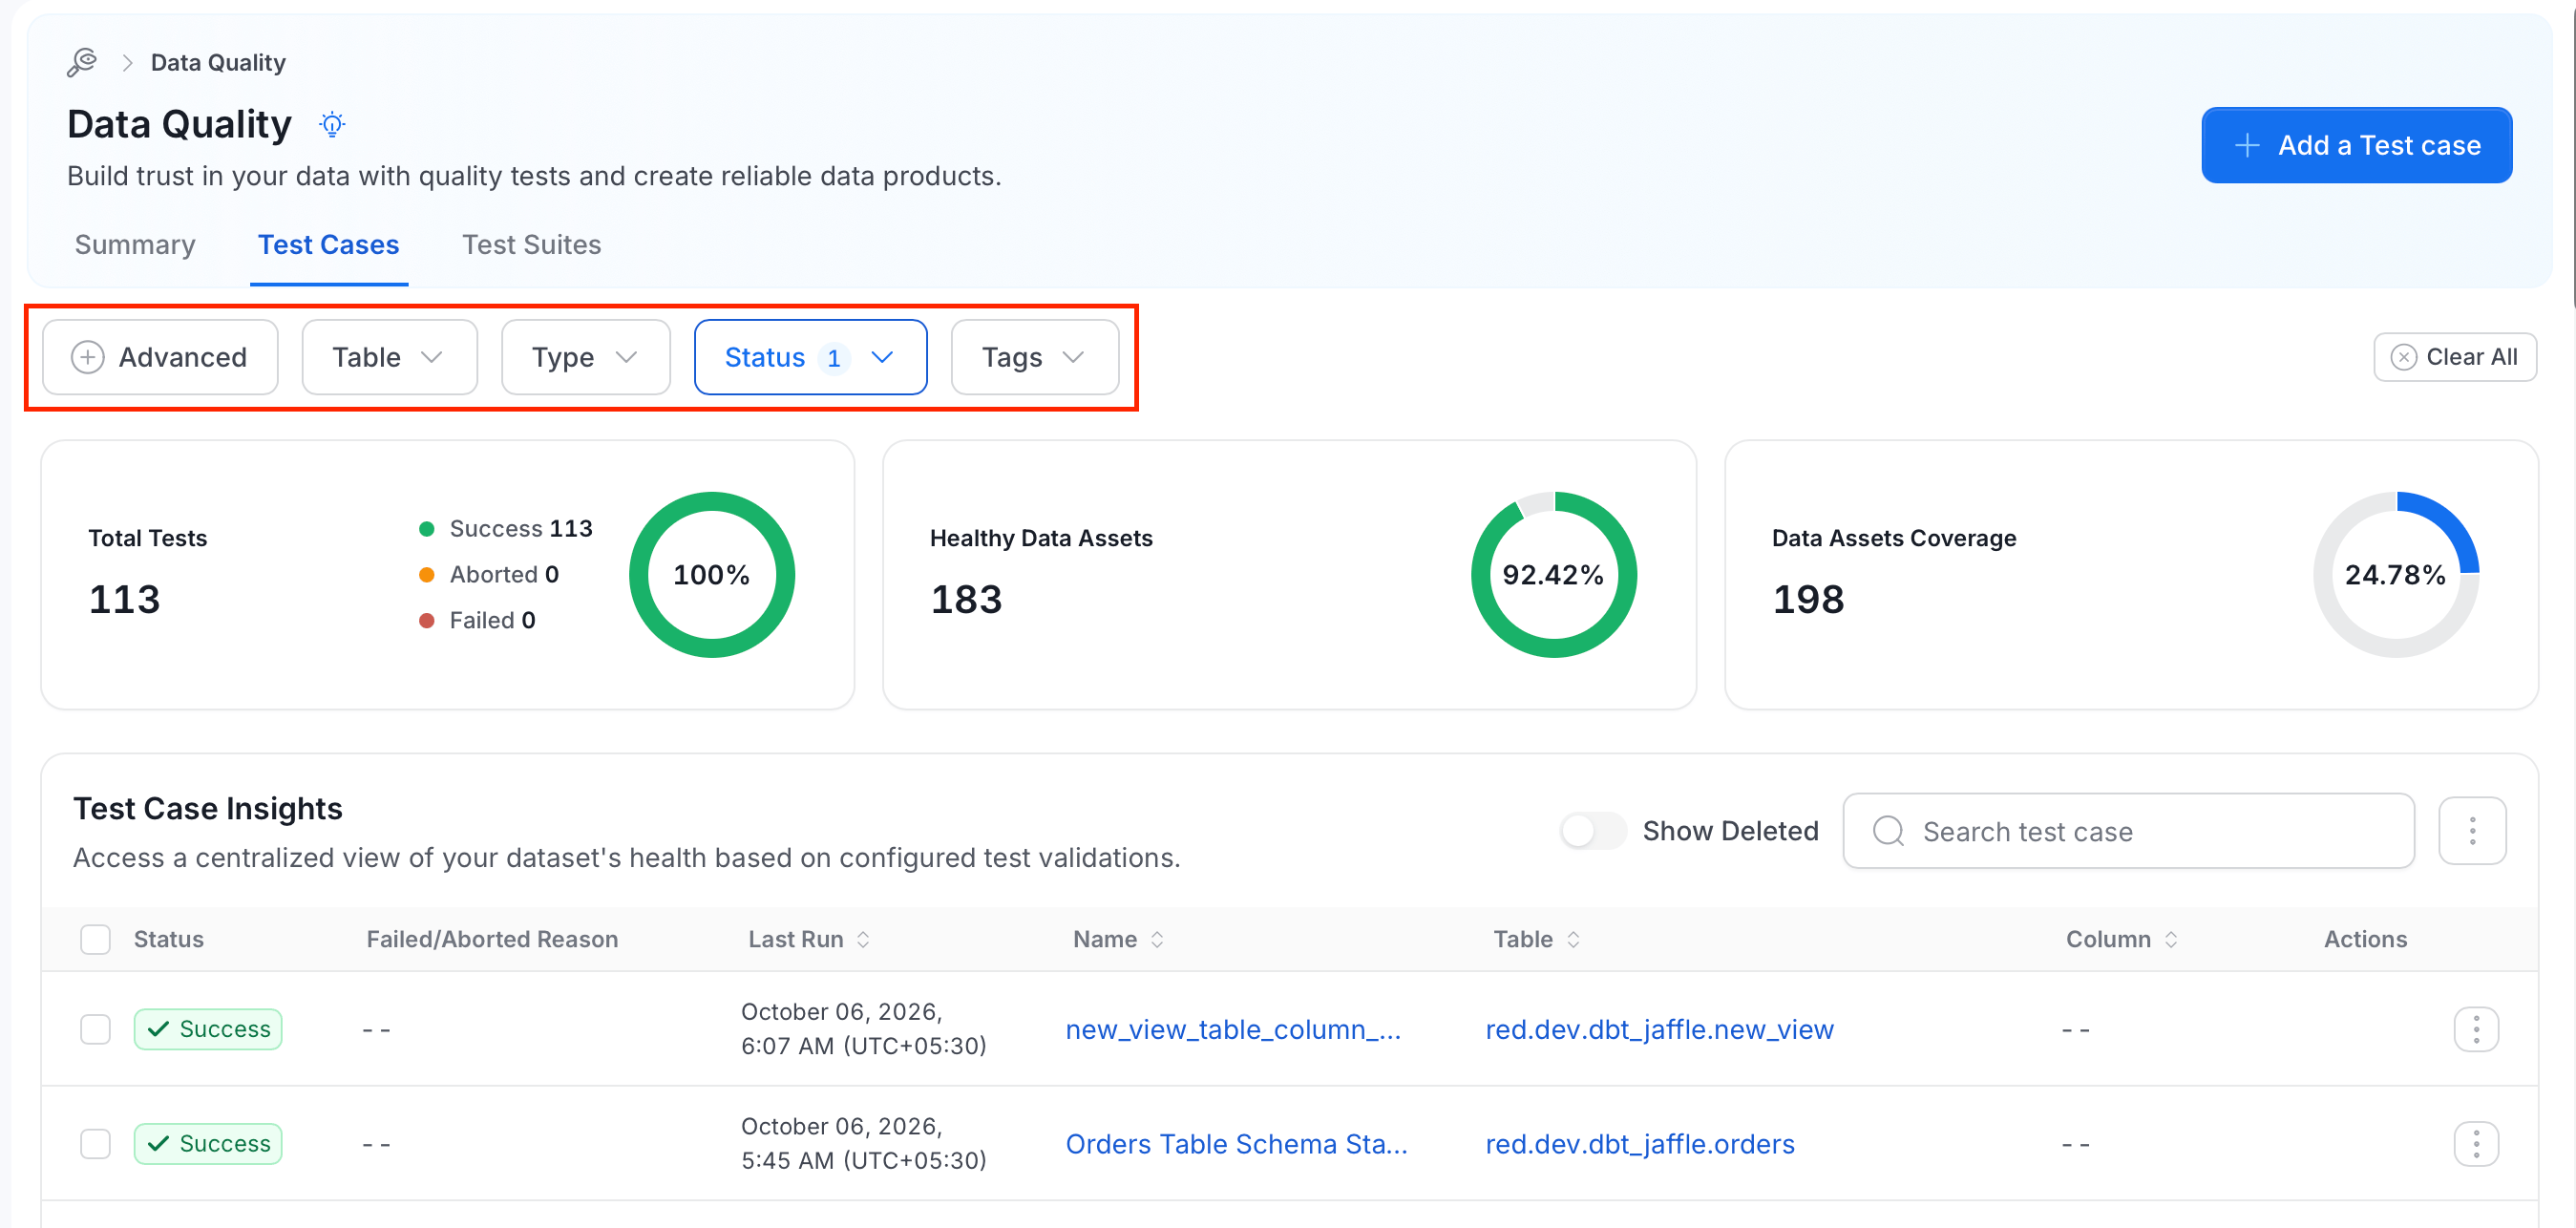
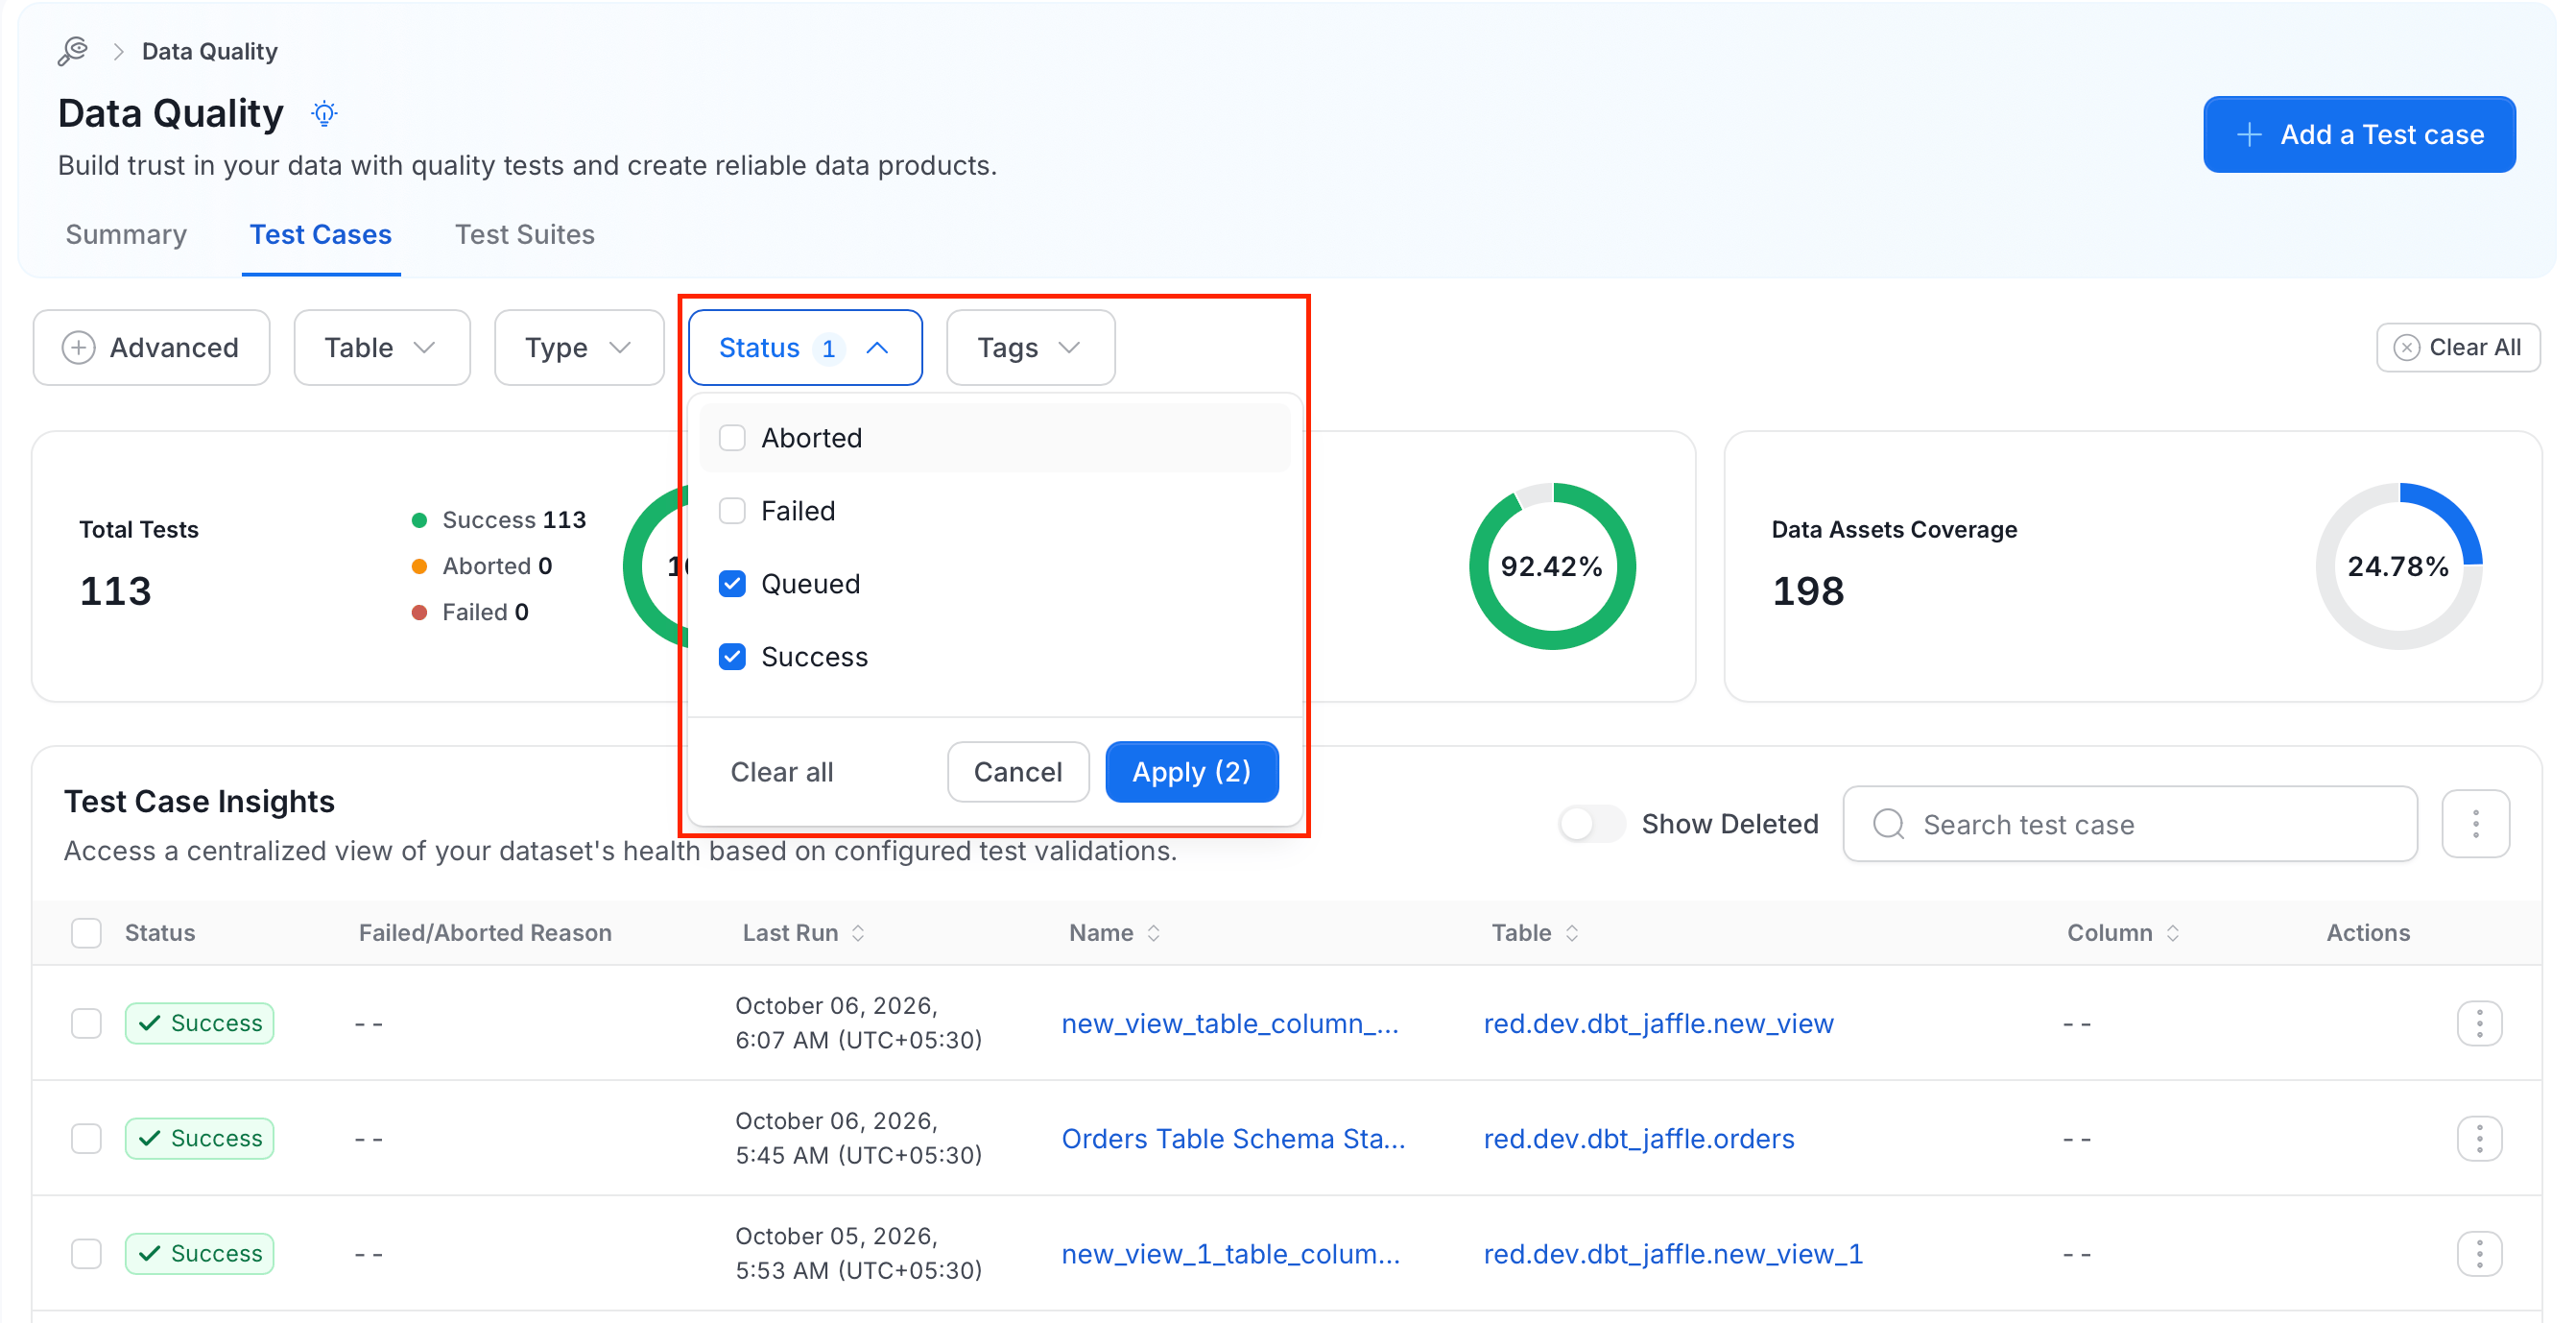
- Click Status.
- Select one or more of Aborted, Failed, Queued, and Success.
-
Click Apply. The button shows how many statuses you selected, for example Apply (2).
Open Test Cases From the Summary Tab
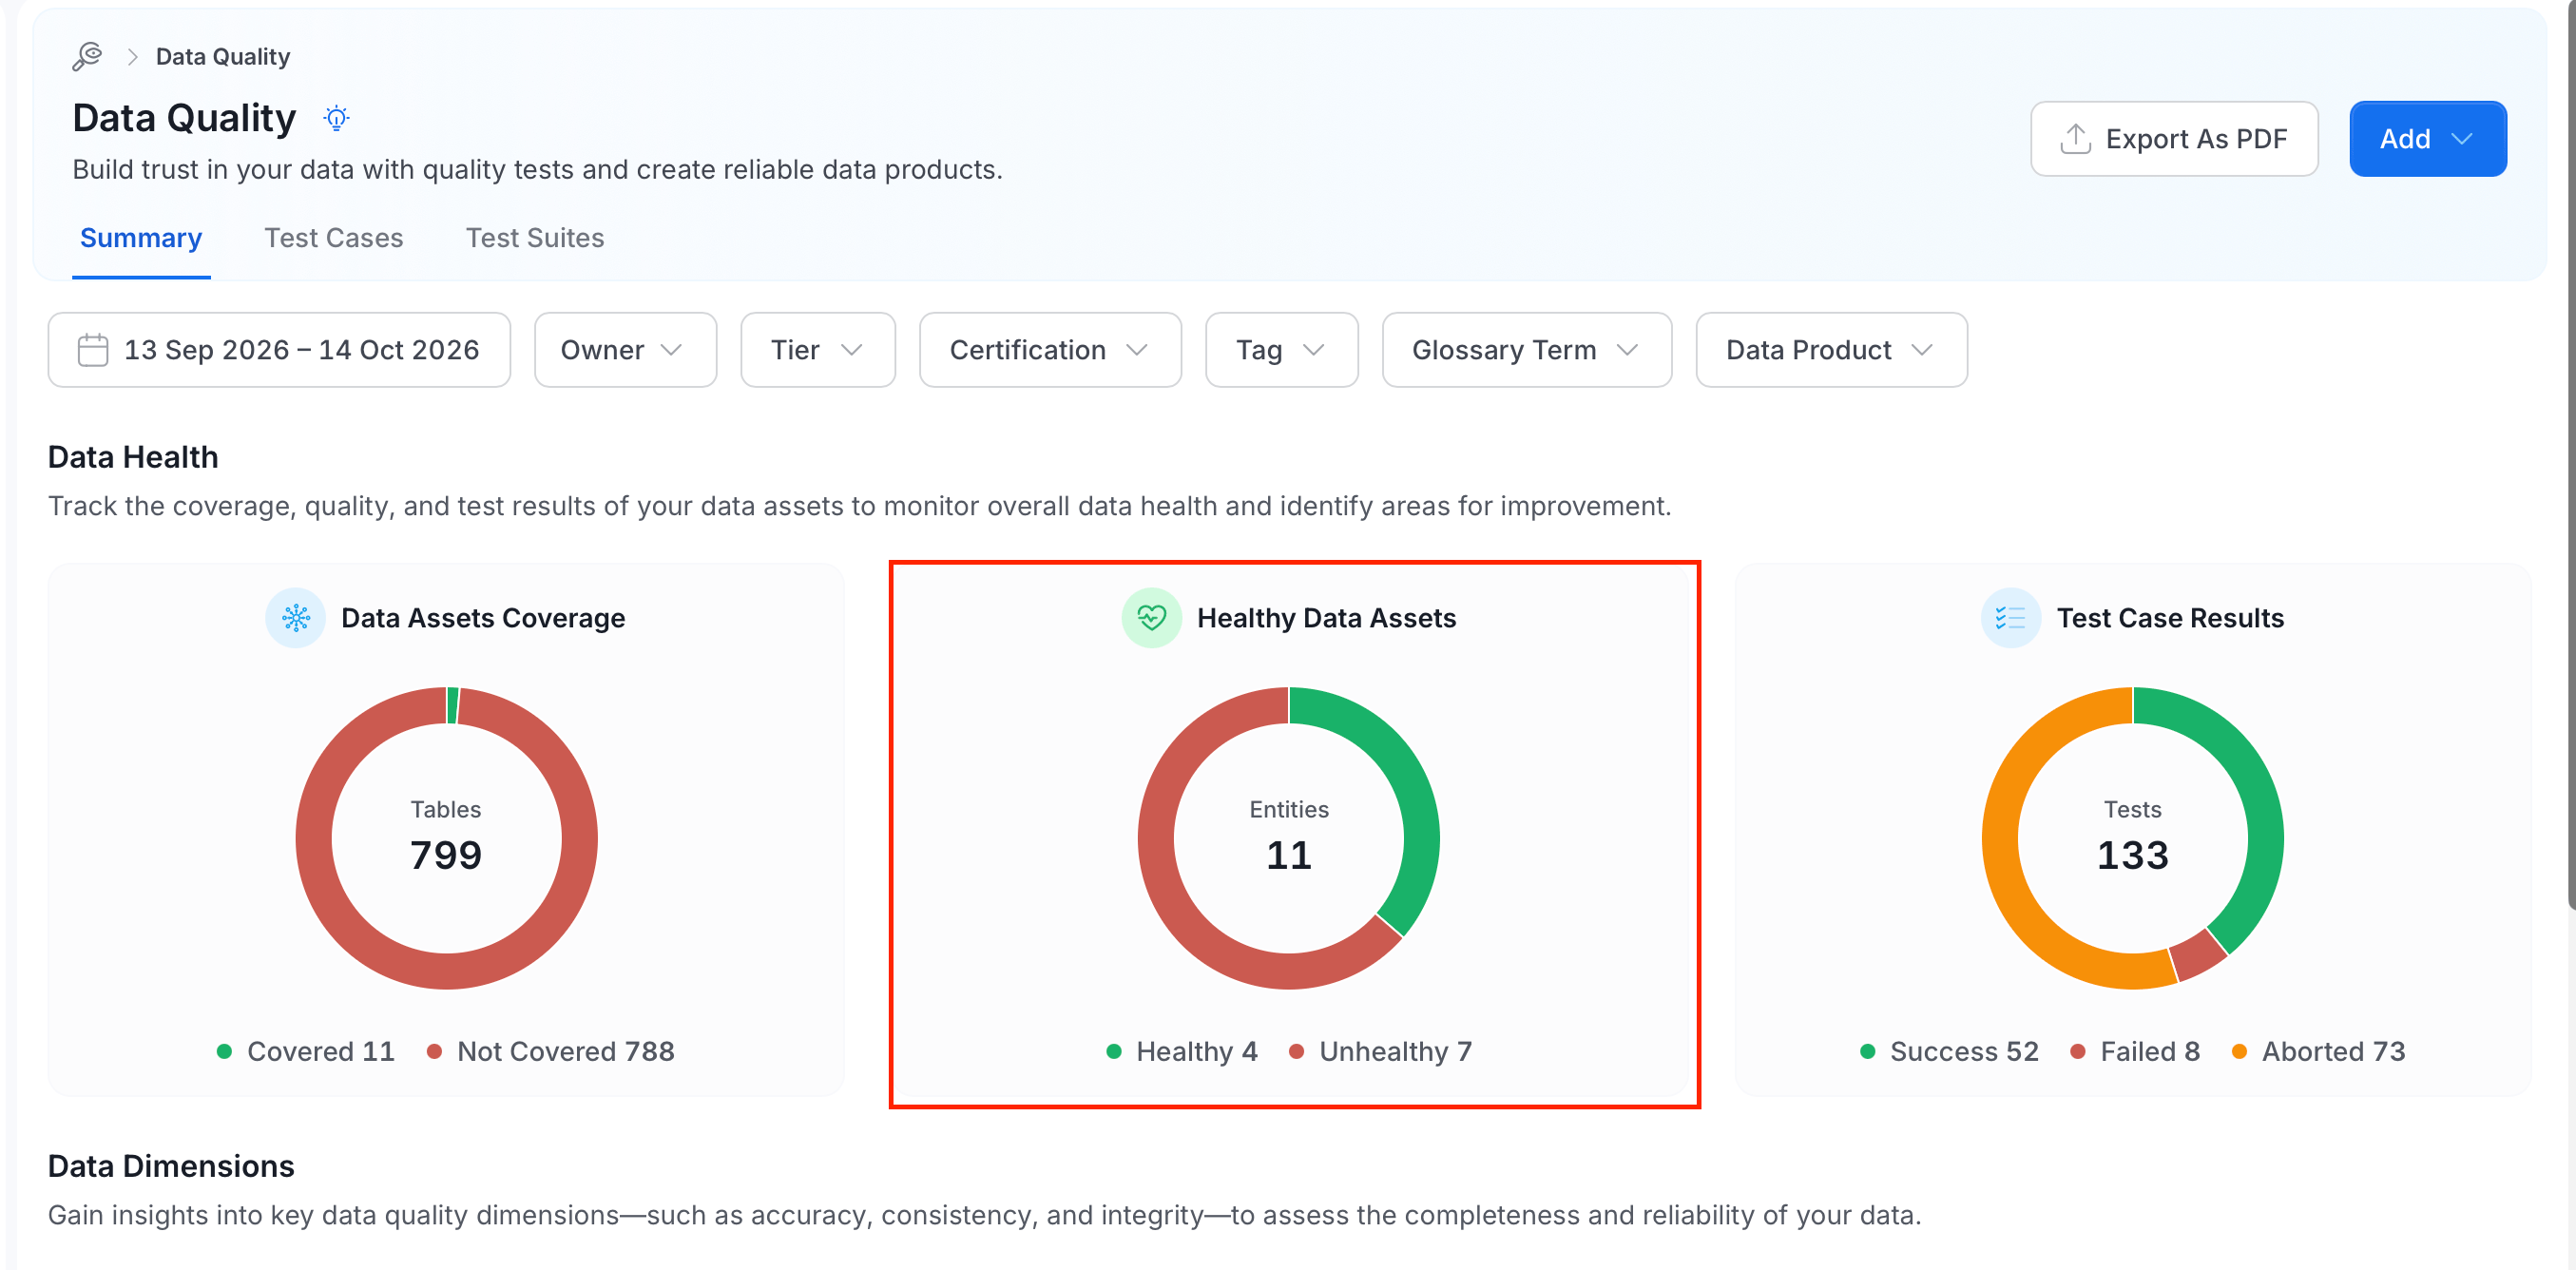
The Summary tab of Data Quality shows Data Health cards. In the Healthy Data Assets card, select the Healthy or Unhealthy segment to open the Test Cases tab with the matching statuses already applied:- Healthy:
SuccessandQueued. - Unhealthy:
FailedandAborted.
Review Result History
To see how a test case has performed over time, open it from Data Quality > Test Cases. The Test Case Results tab shows:- Last run:
- The latest status and a message with the measured value and the expected range.
- The Result / Expected values.
- The run time and when the next run is due, or Not Scheduled.
- Result history: a chart of the measured value over time. The caption shows what is measured and what it is compared against, for example “Column count vs. allowed range 2–10”. A dashed line marks the allowed limit.
- Configuration, Description, Test Suites, Tags, Glossary Term, and Data Products panels beside the chart.
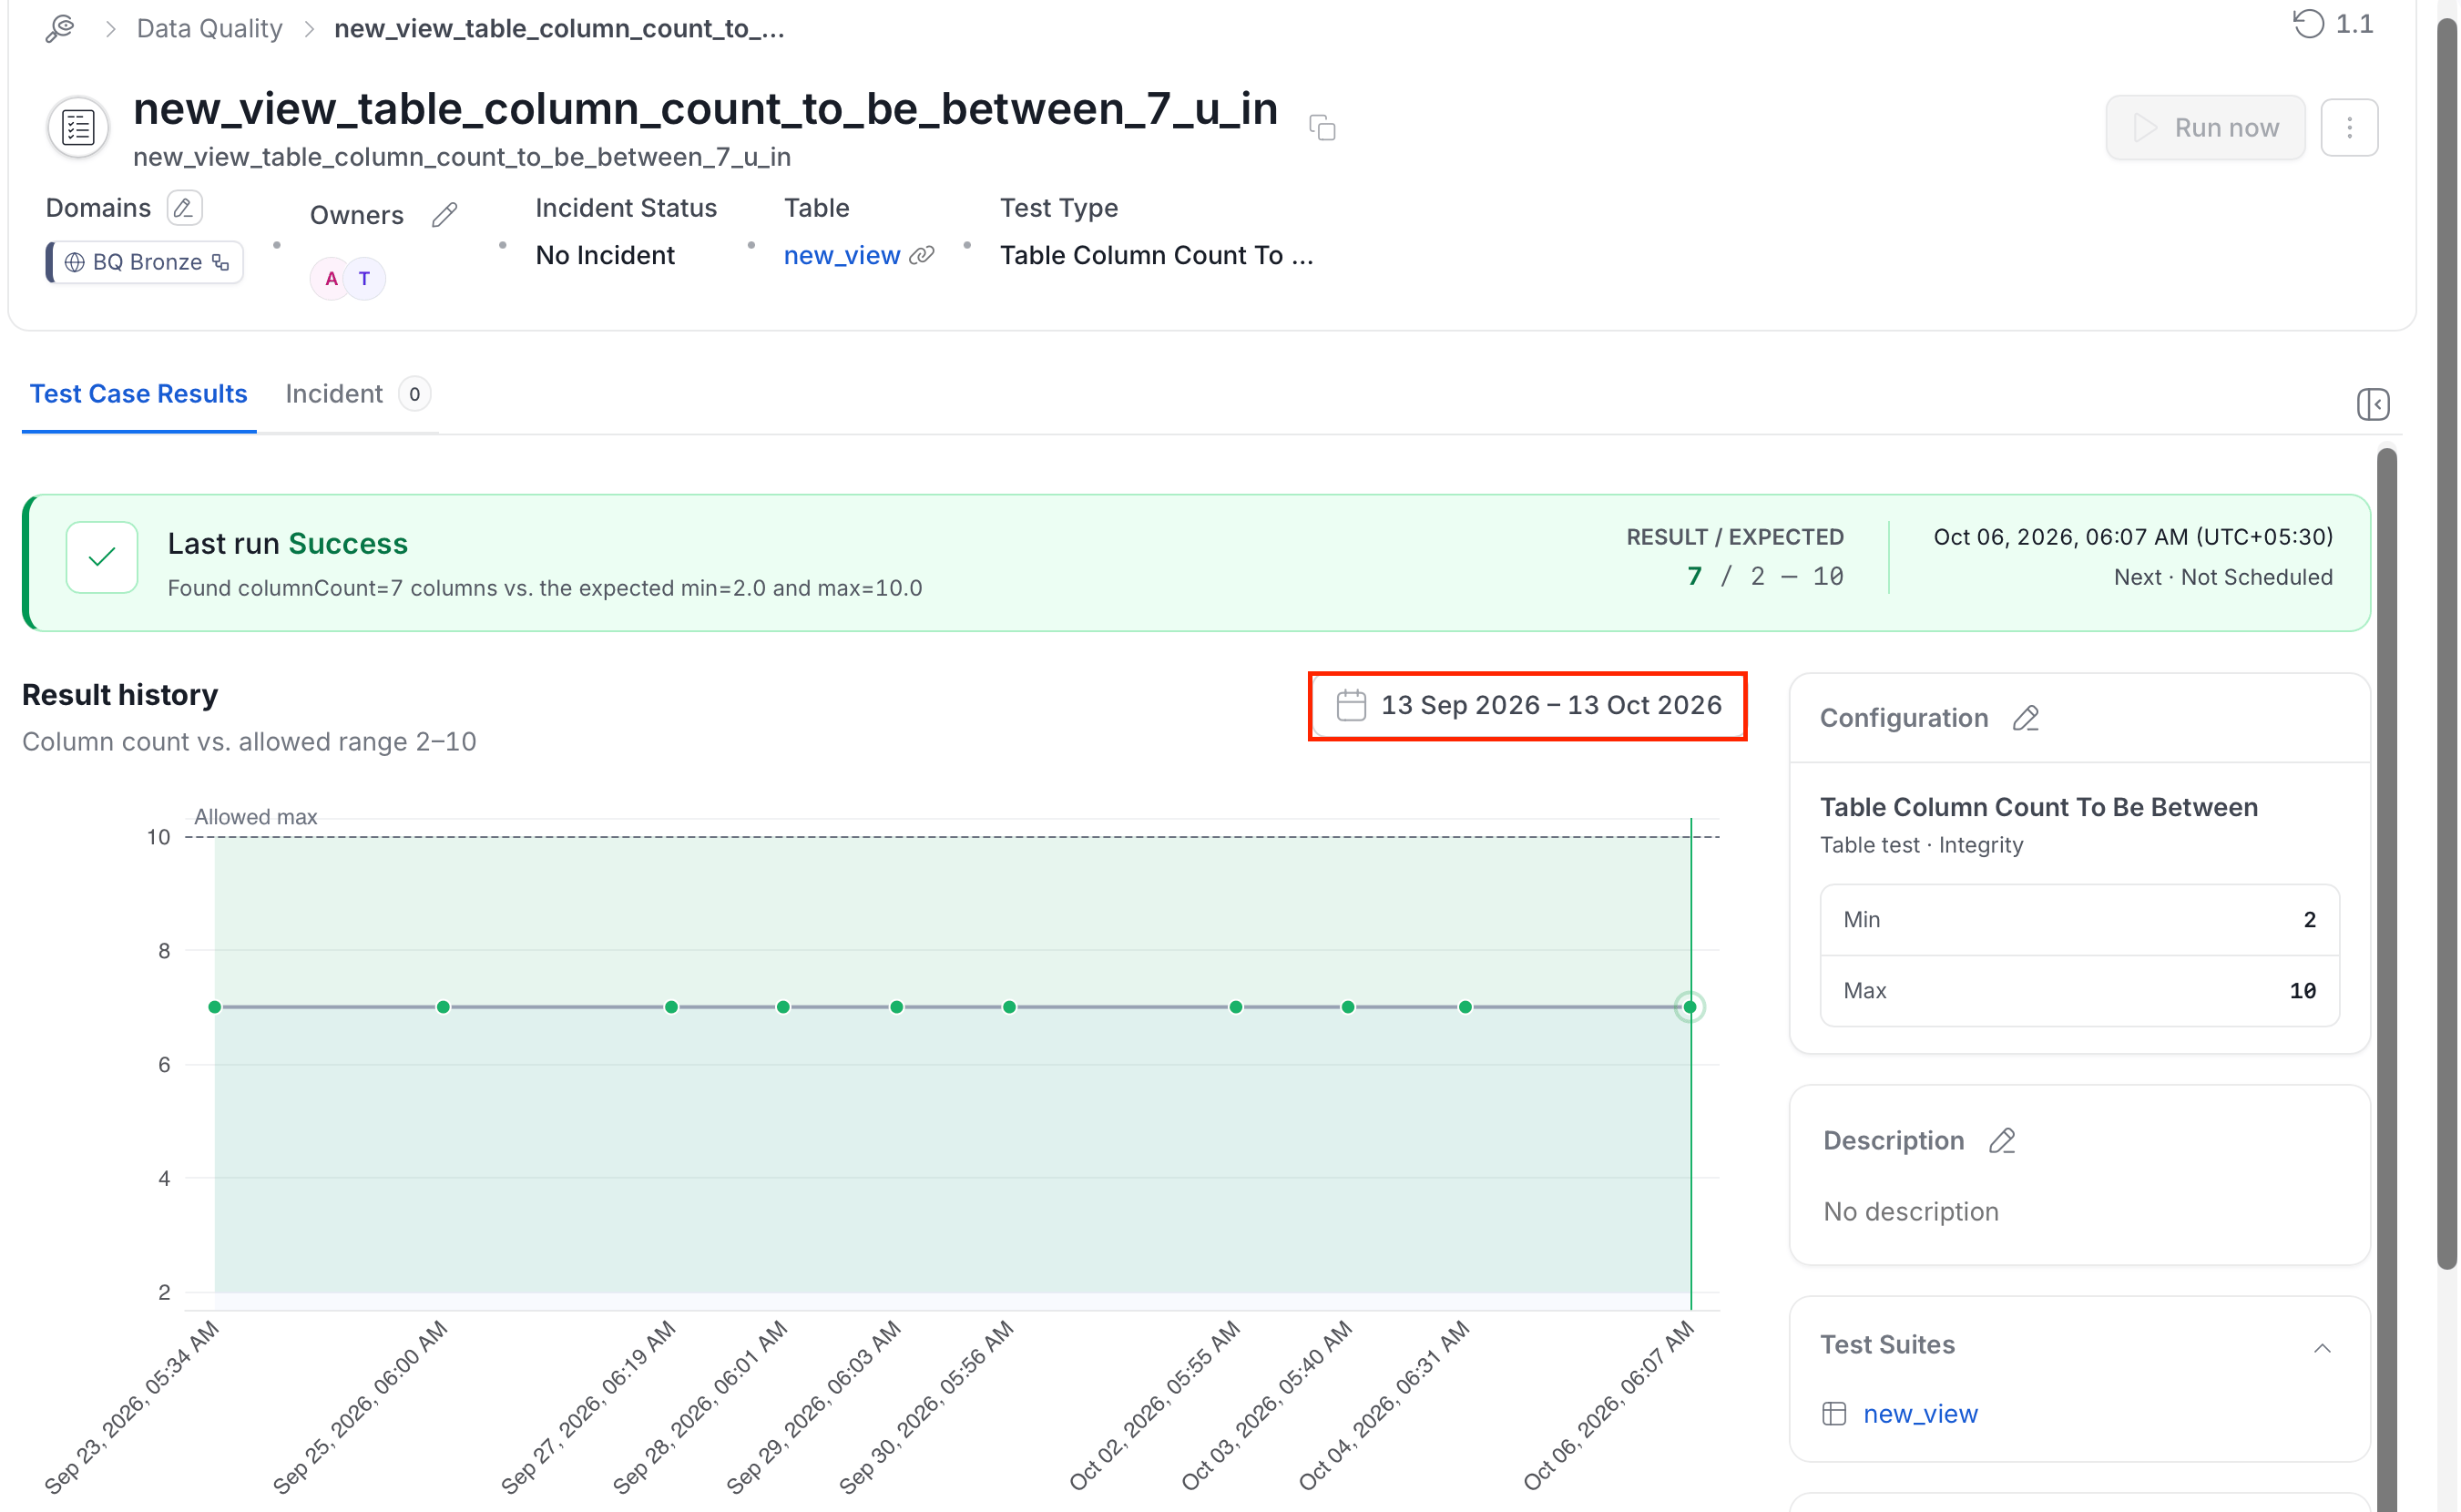
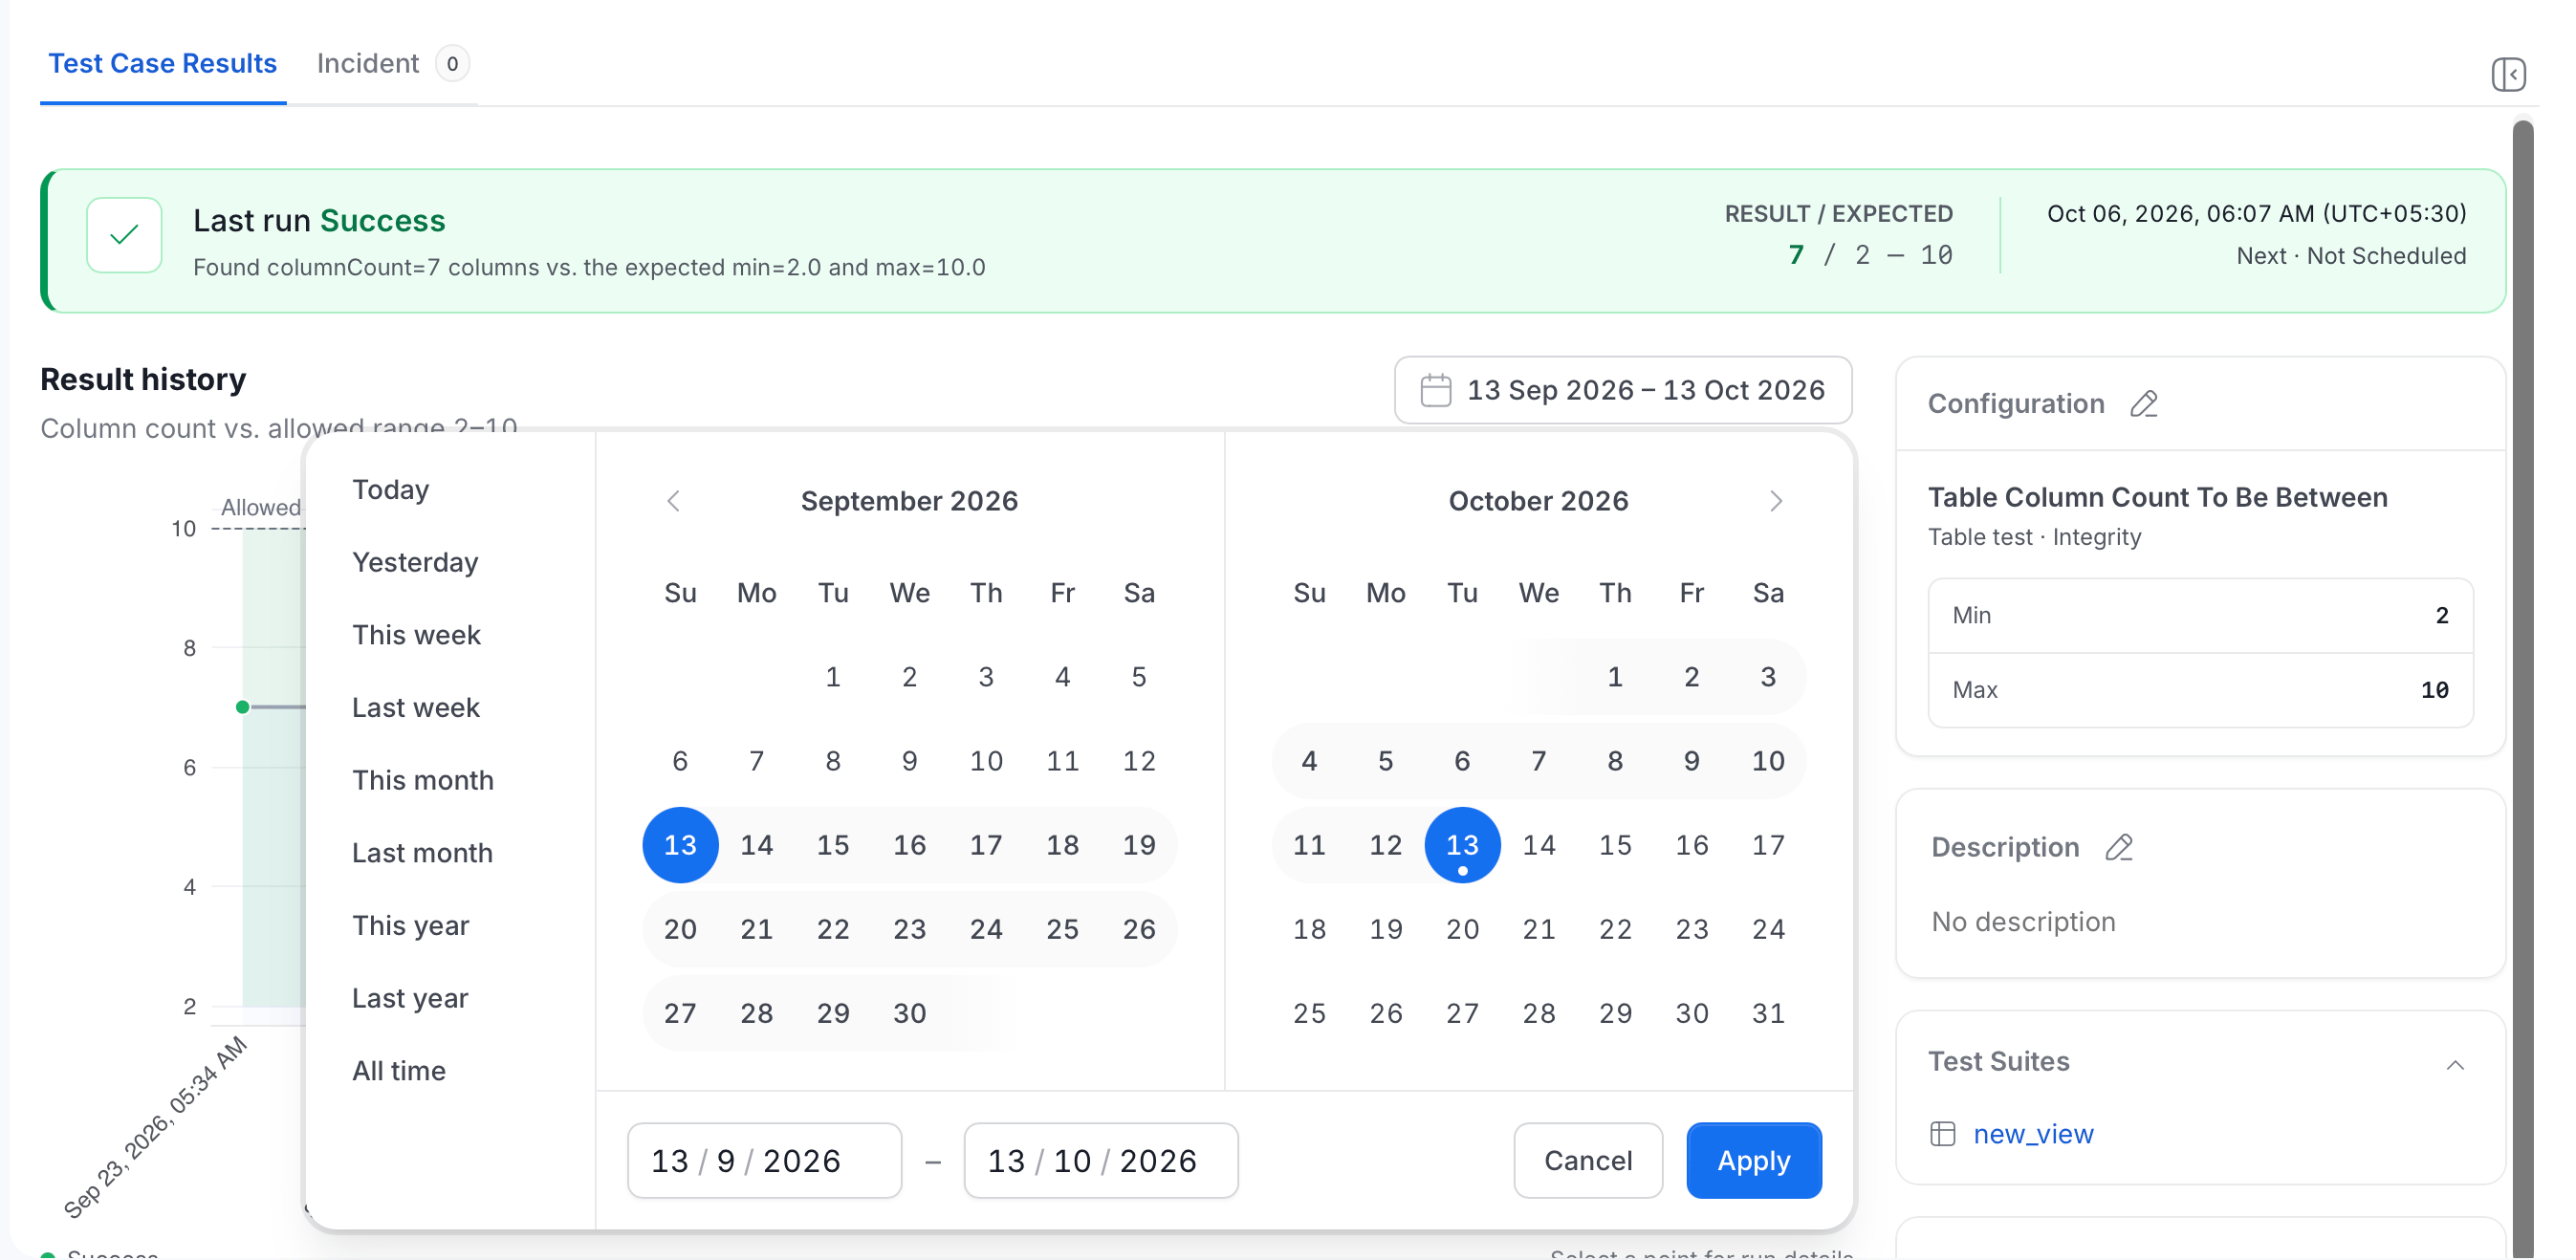
- Click the date range on the Result history card. By default it covers the last 30 days and ends today.
- Choose a time range in one of two ways:
- Select a preset: Today, Yesterday, This week, Last week, This month, Last month, This year, Last year, or All time.
- Pick start and end dates on the calendars, or type them in the date fields.
- Click Apply.
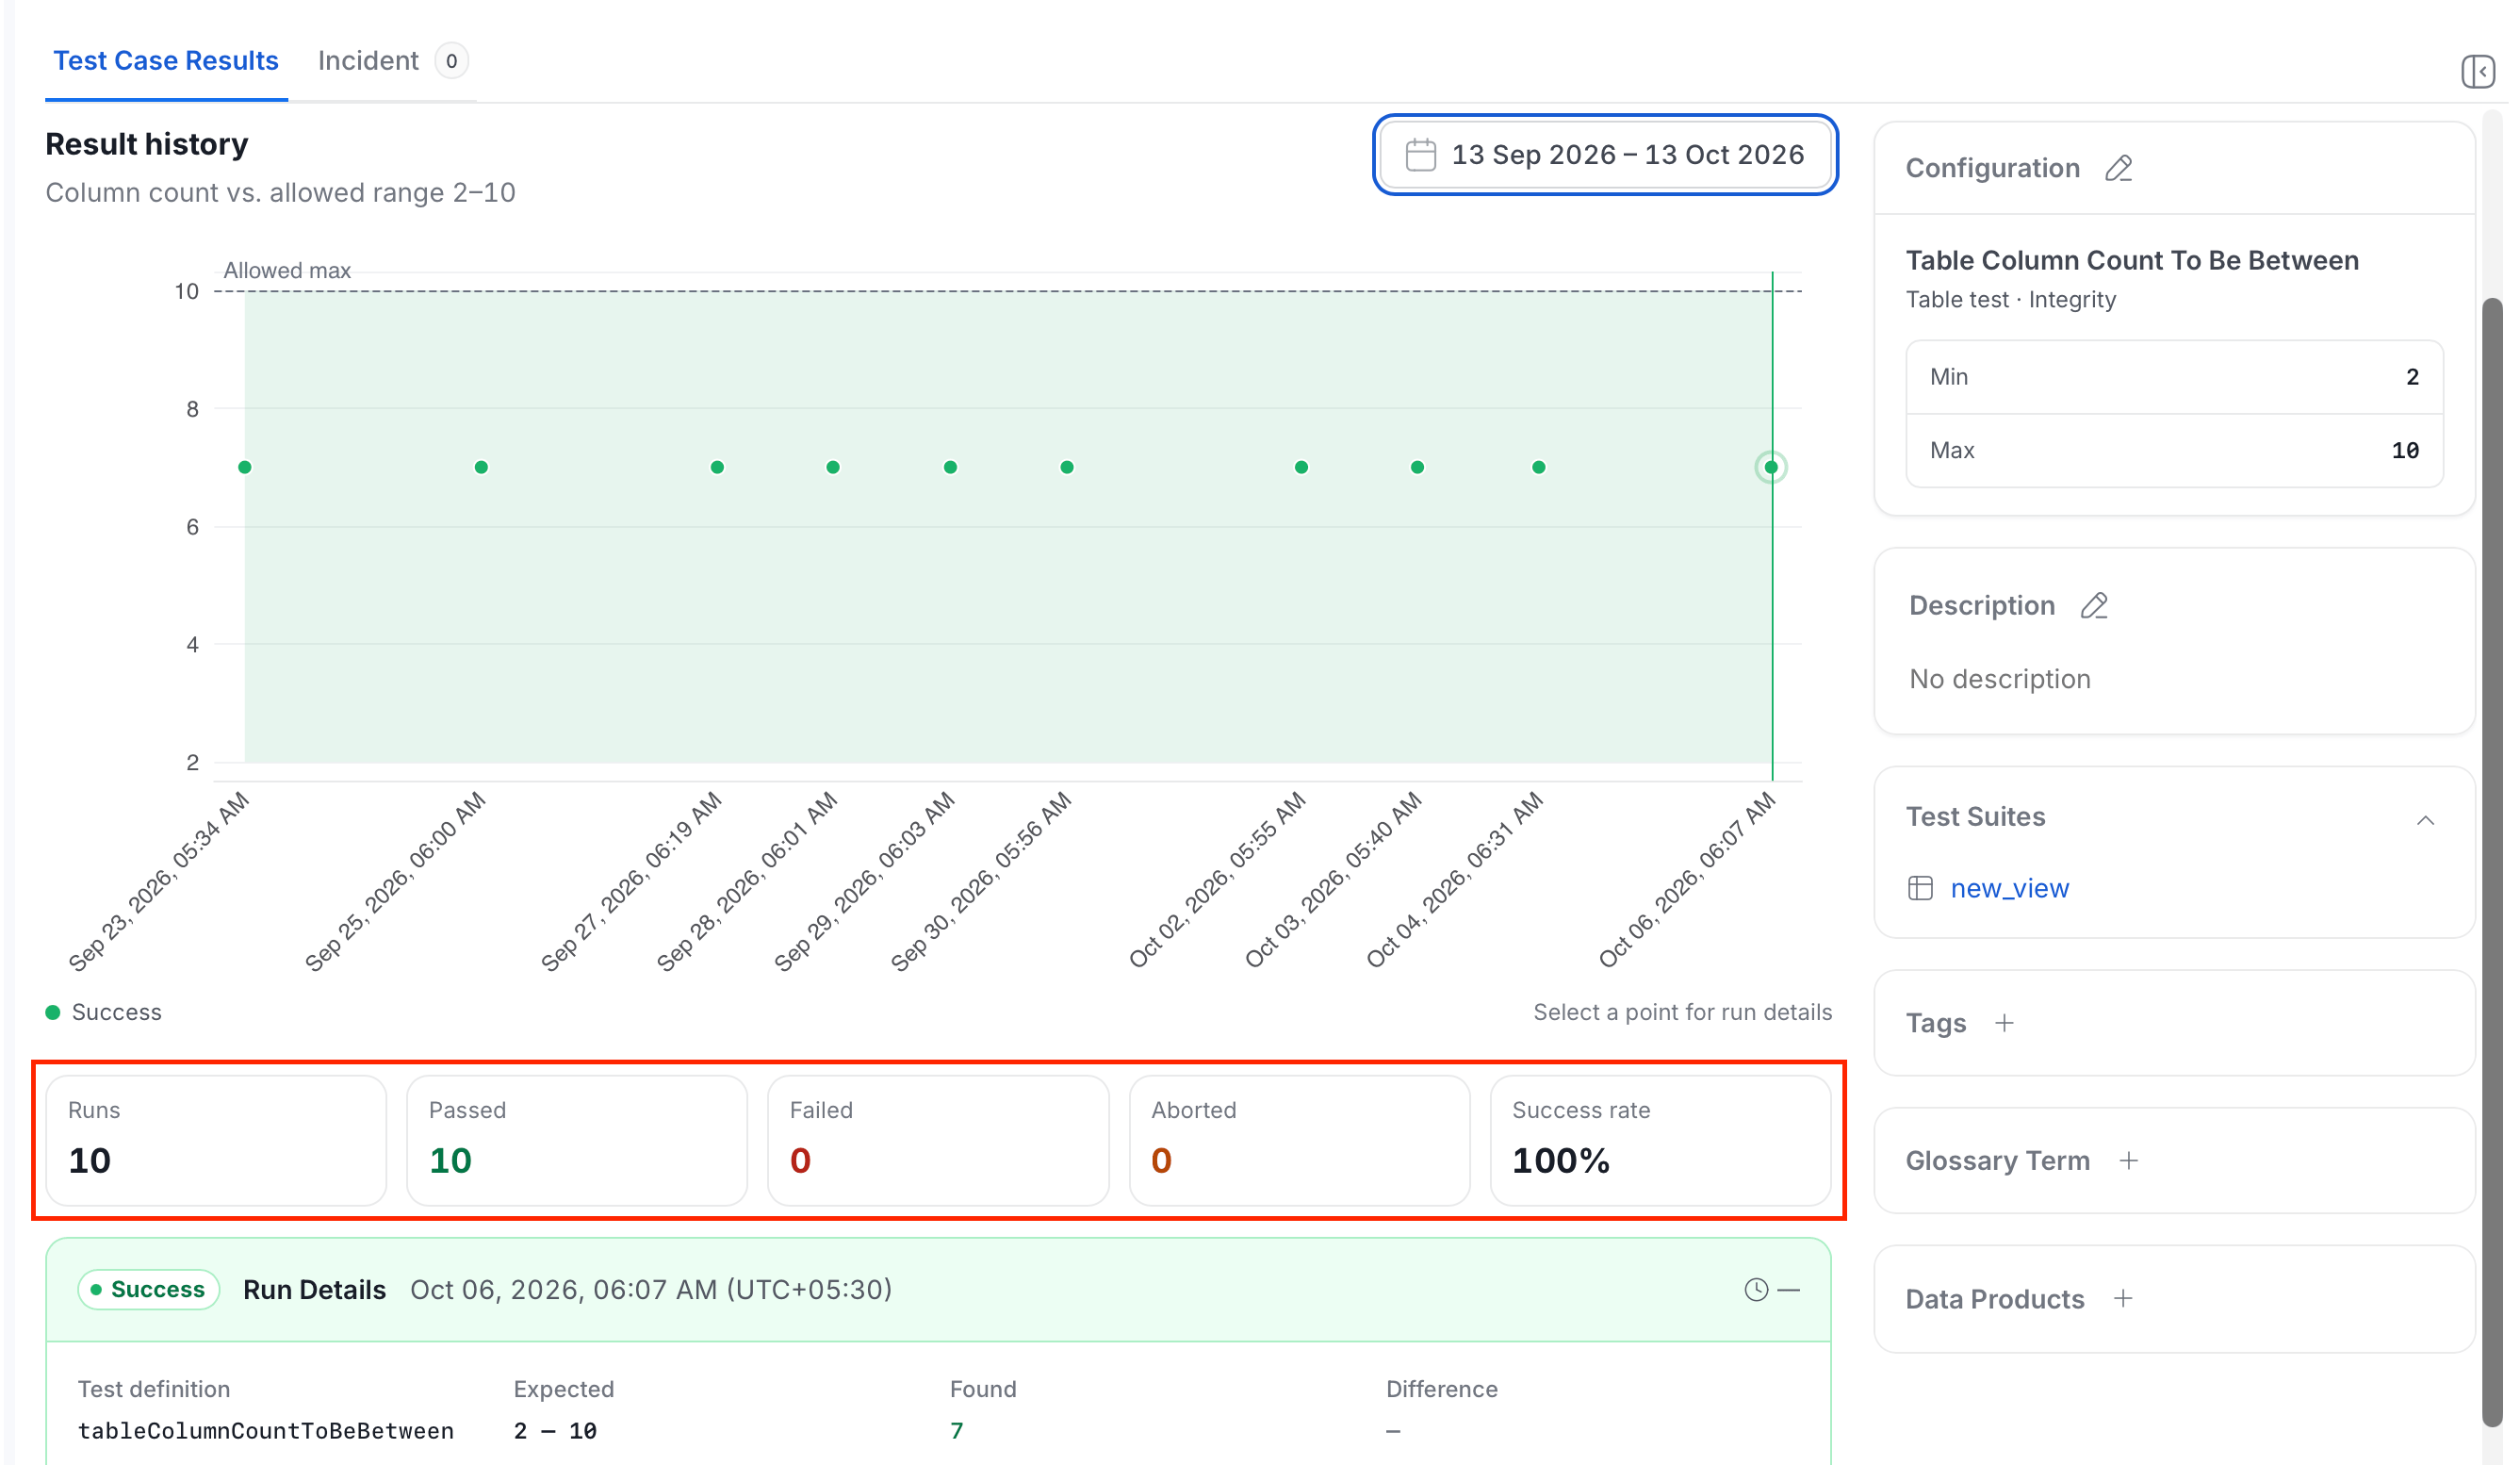
Queued runs count toward Runs but not toward the success rate, so the tiles might not add up to Runs. The success rate shows a dash when no run has completed.
Review Run Details
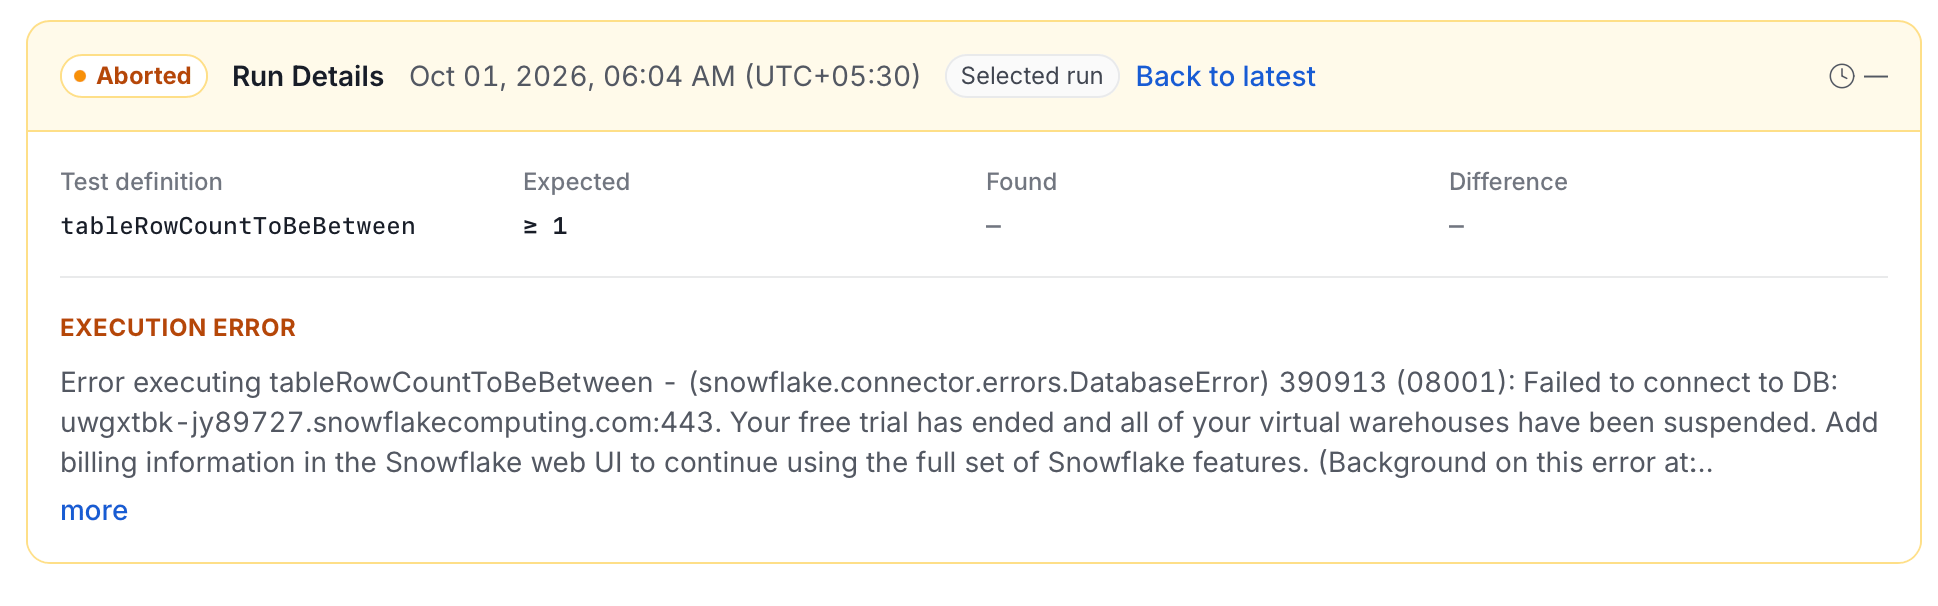
Below the tiles, the Run Details card shows the latest run by default. Hover over a point on the chart to see its time and status. Select a point to show that run. The card then shows a Selected run label, and Back to latest returns to the latest run. The card shows the run status and time, and the test definition. It also shows the Expected, Found, and Difference values. For an aborted run, Found and Difference show a dash, because the run didn’t produce a result.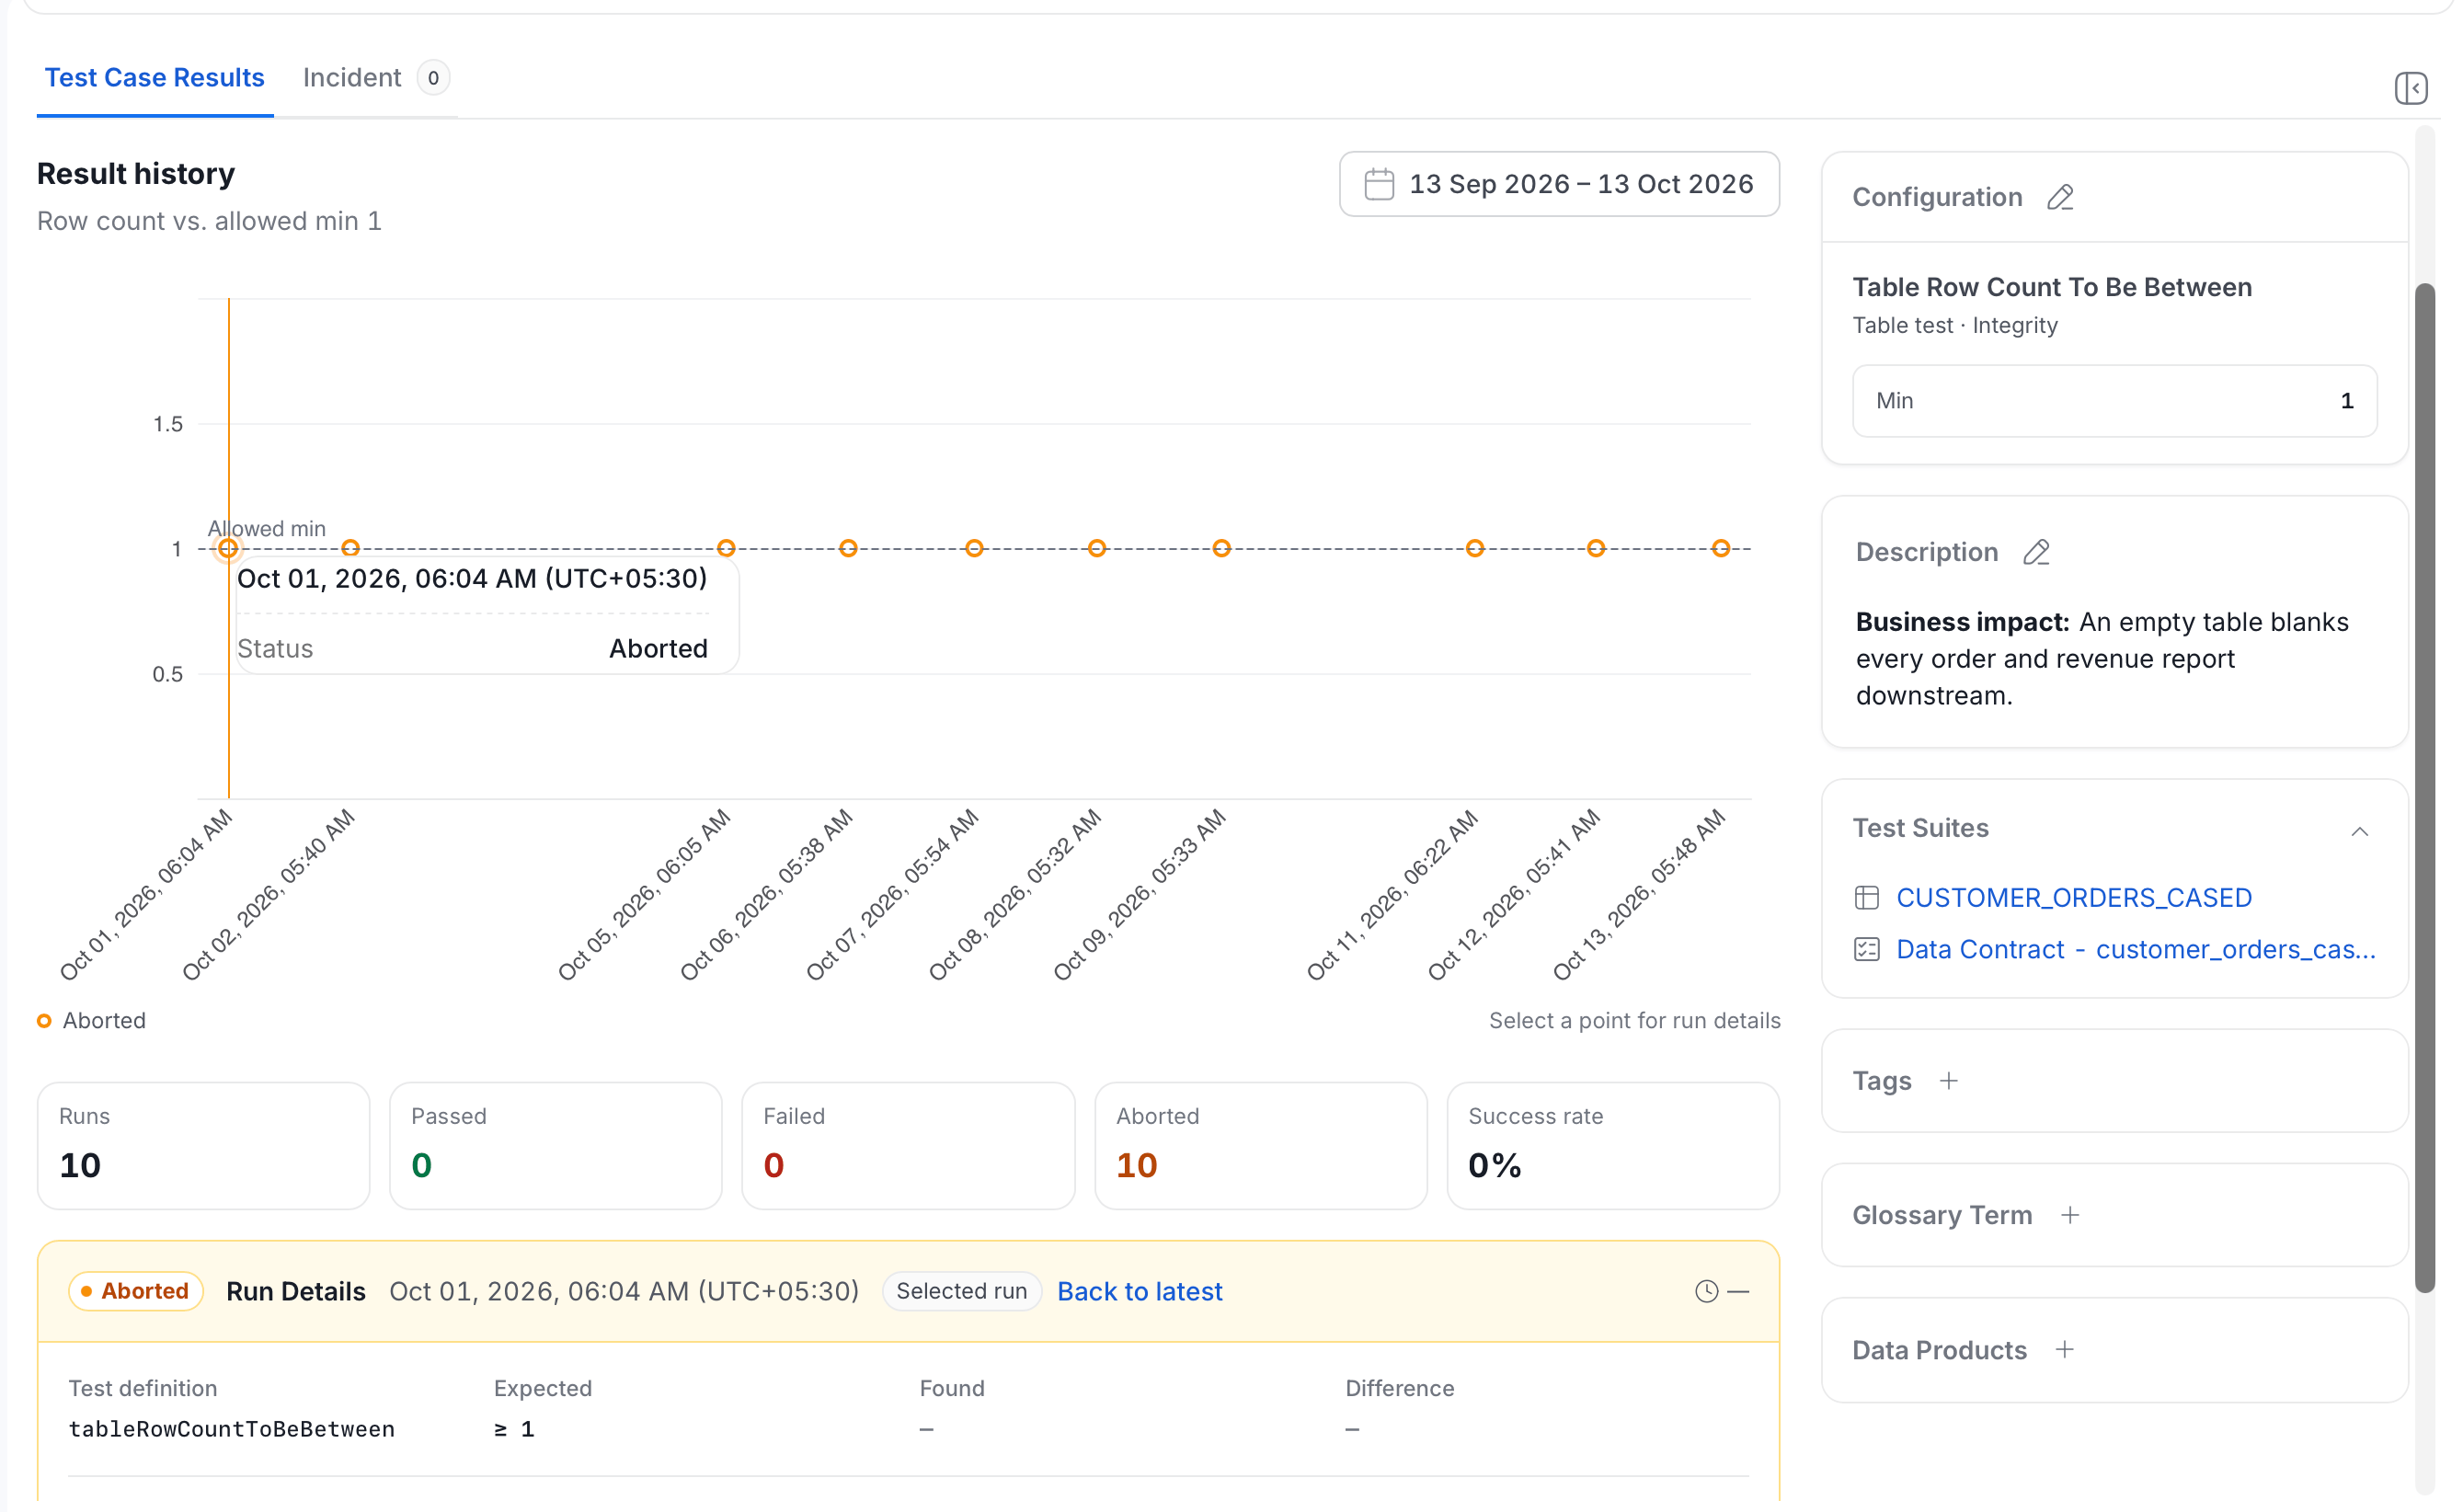
Set Up a Pipeline
Set up a pipeline to run test cases at a regular interval, or on demand.-
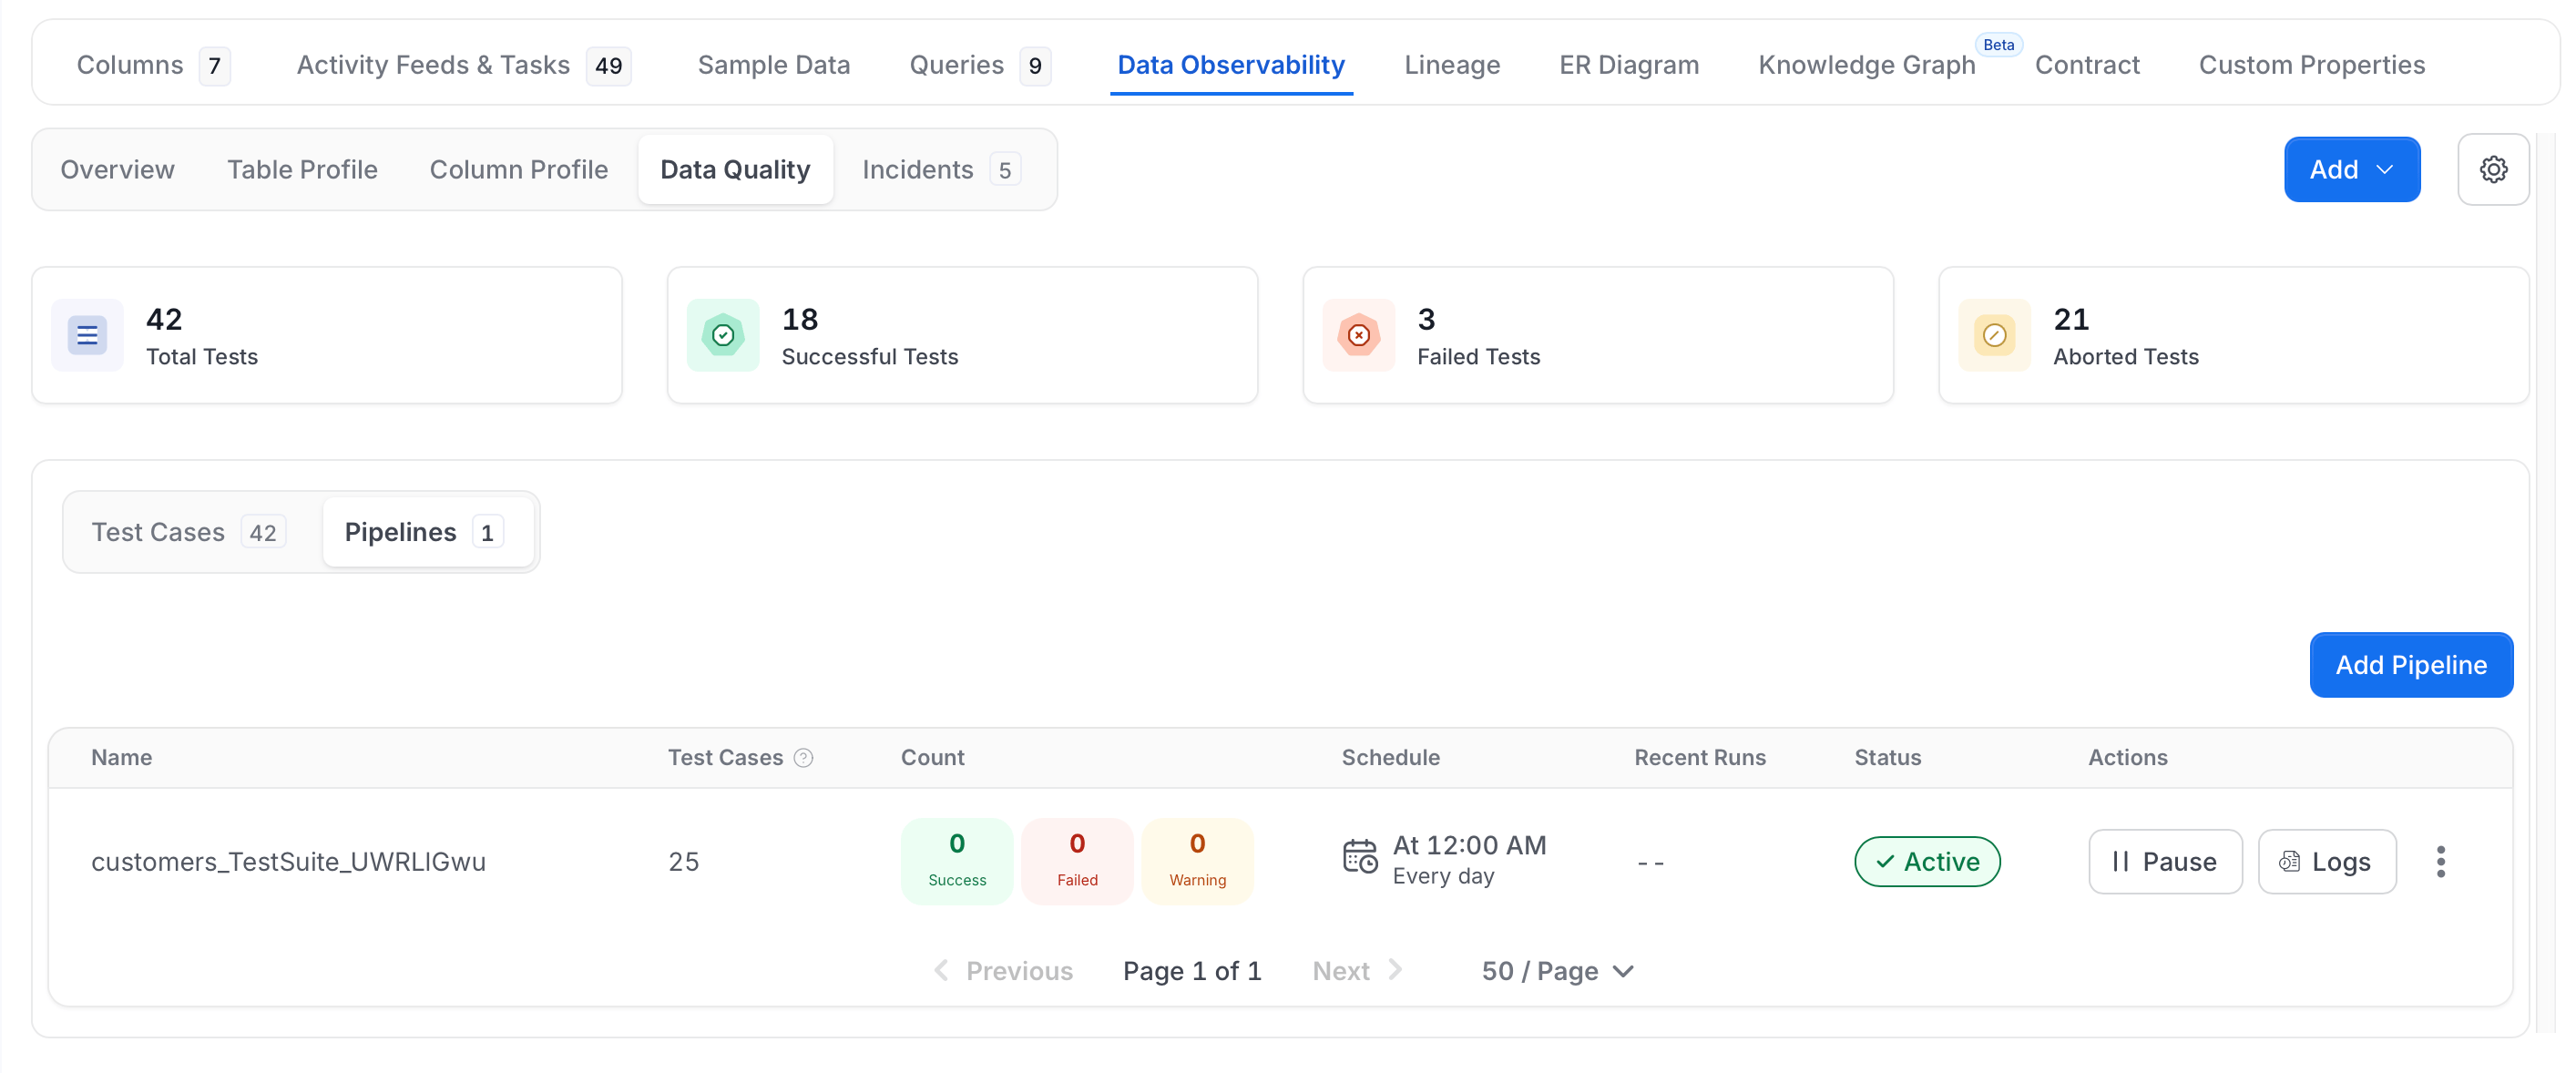
Open the test suite and click the Pipeline tab.
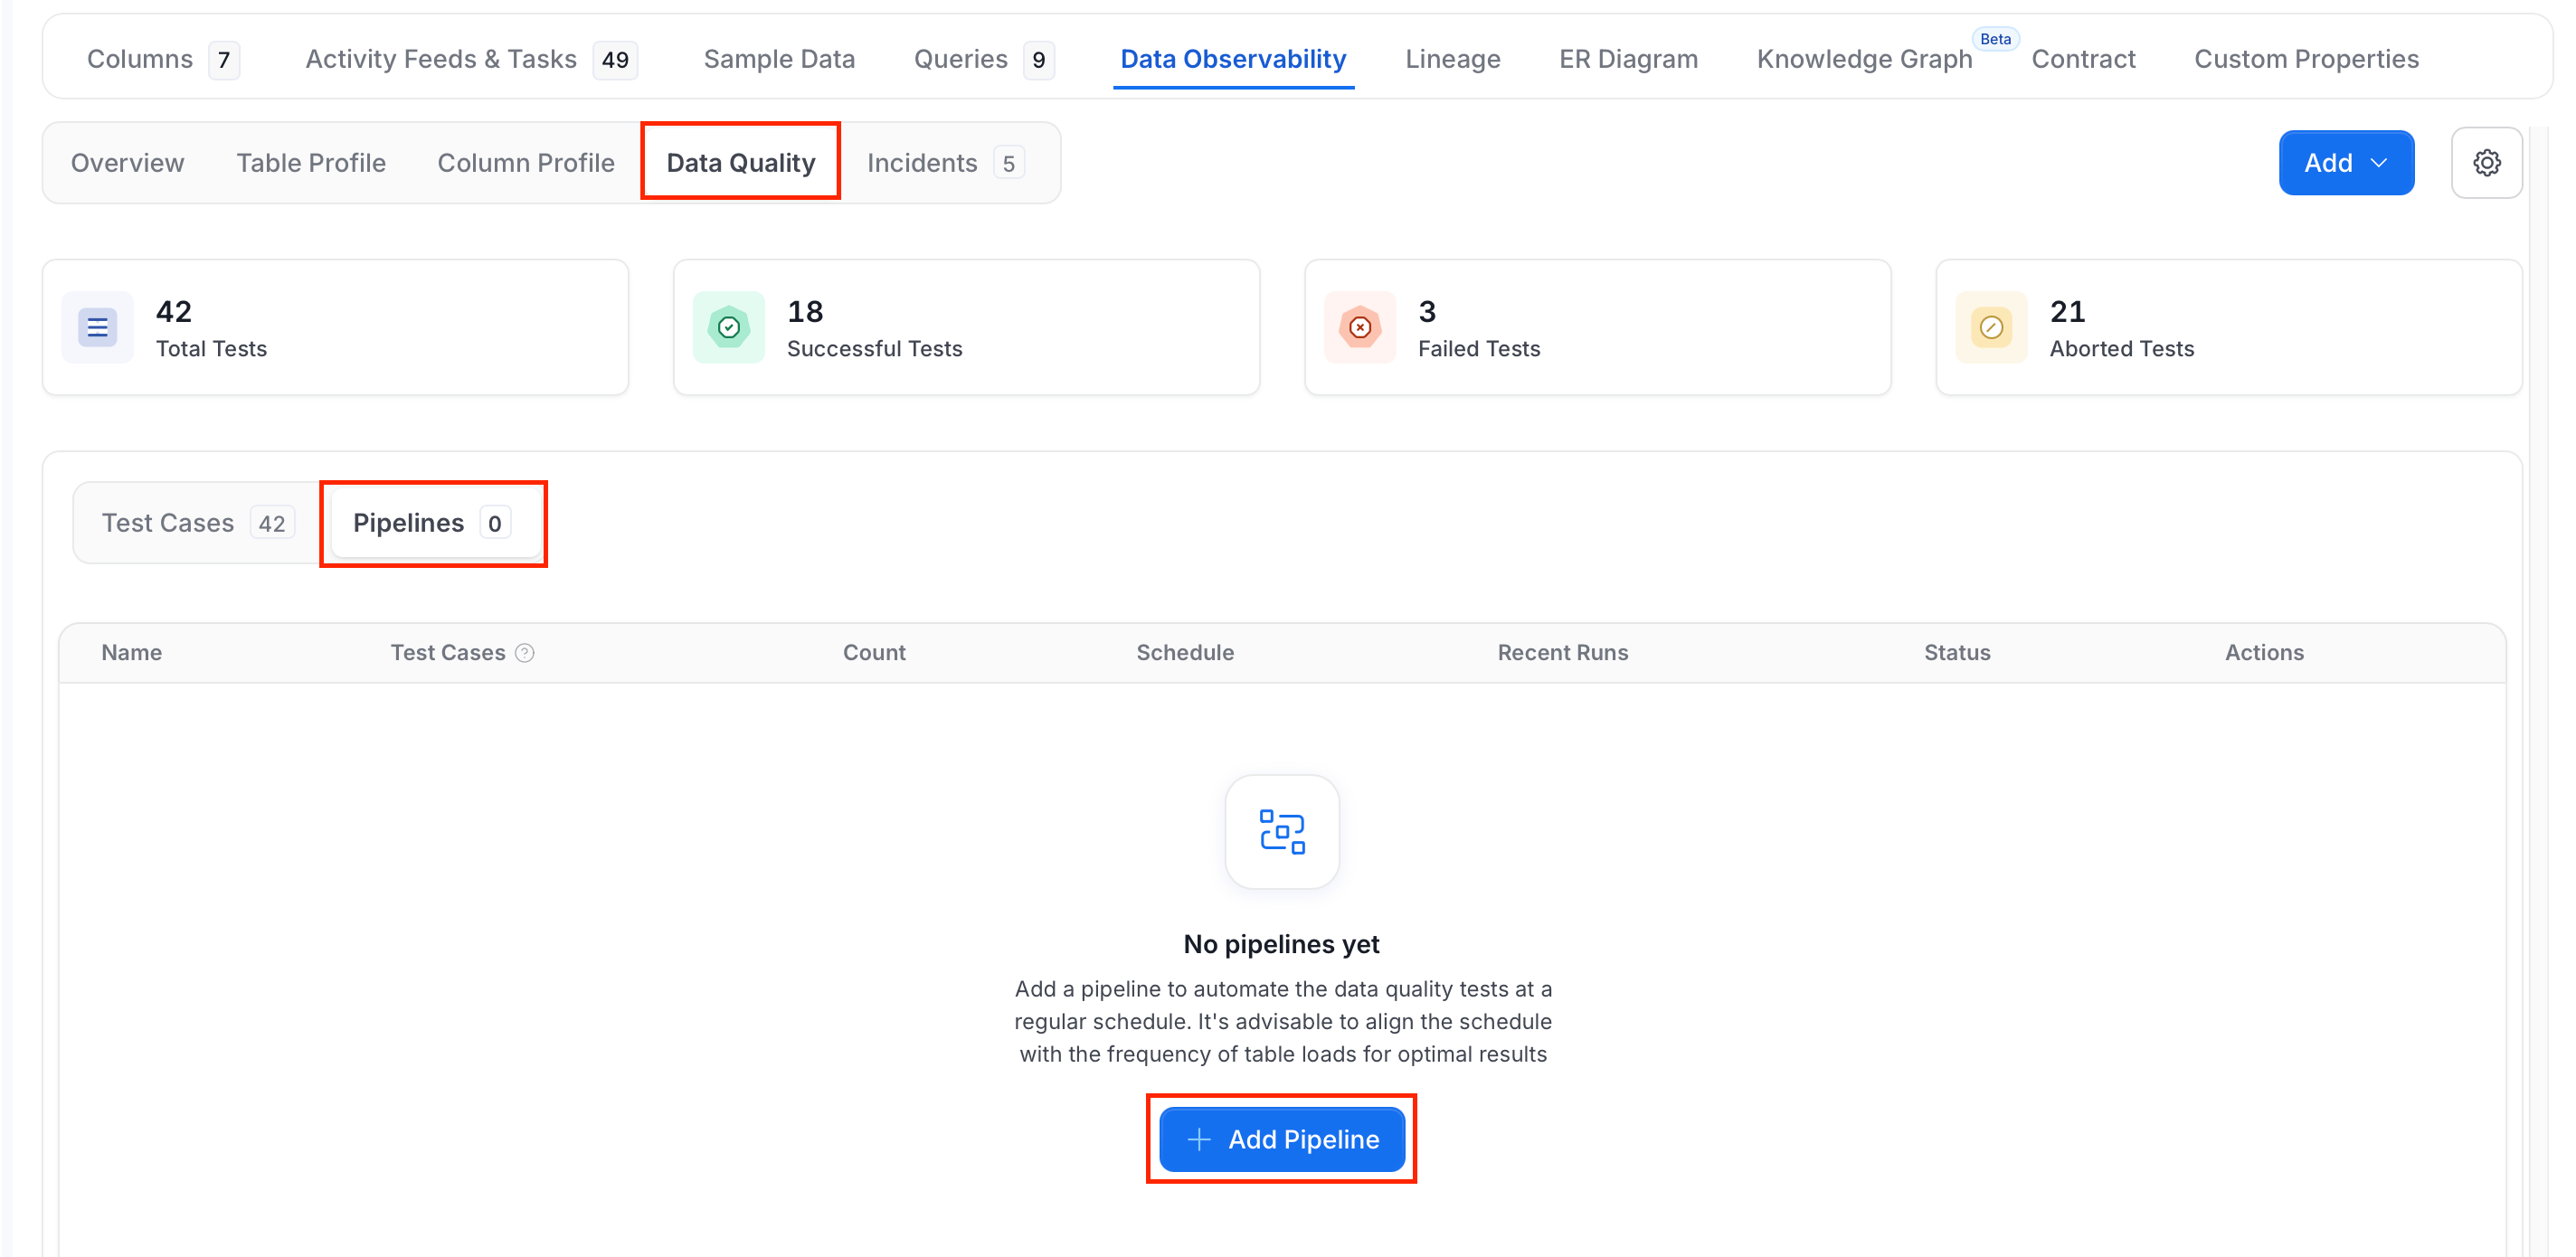
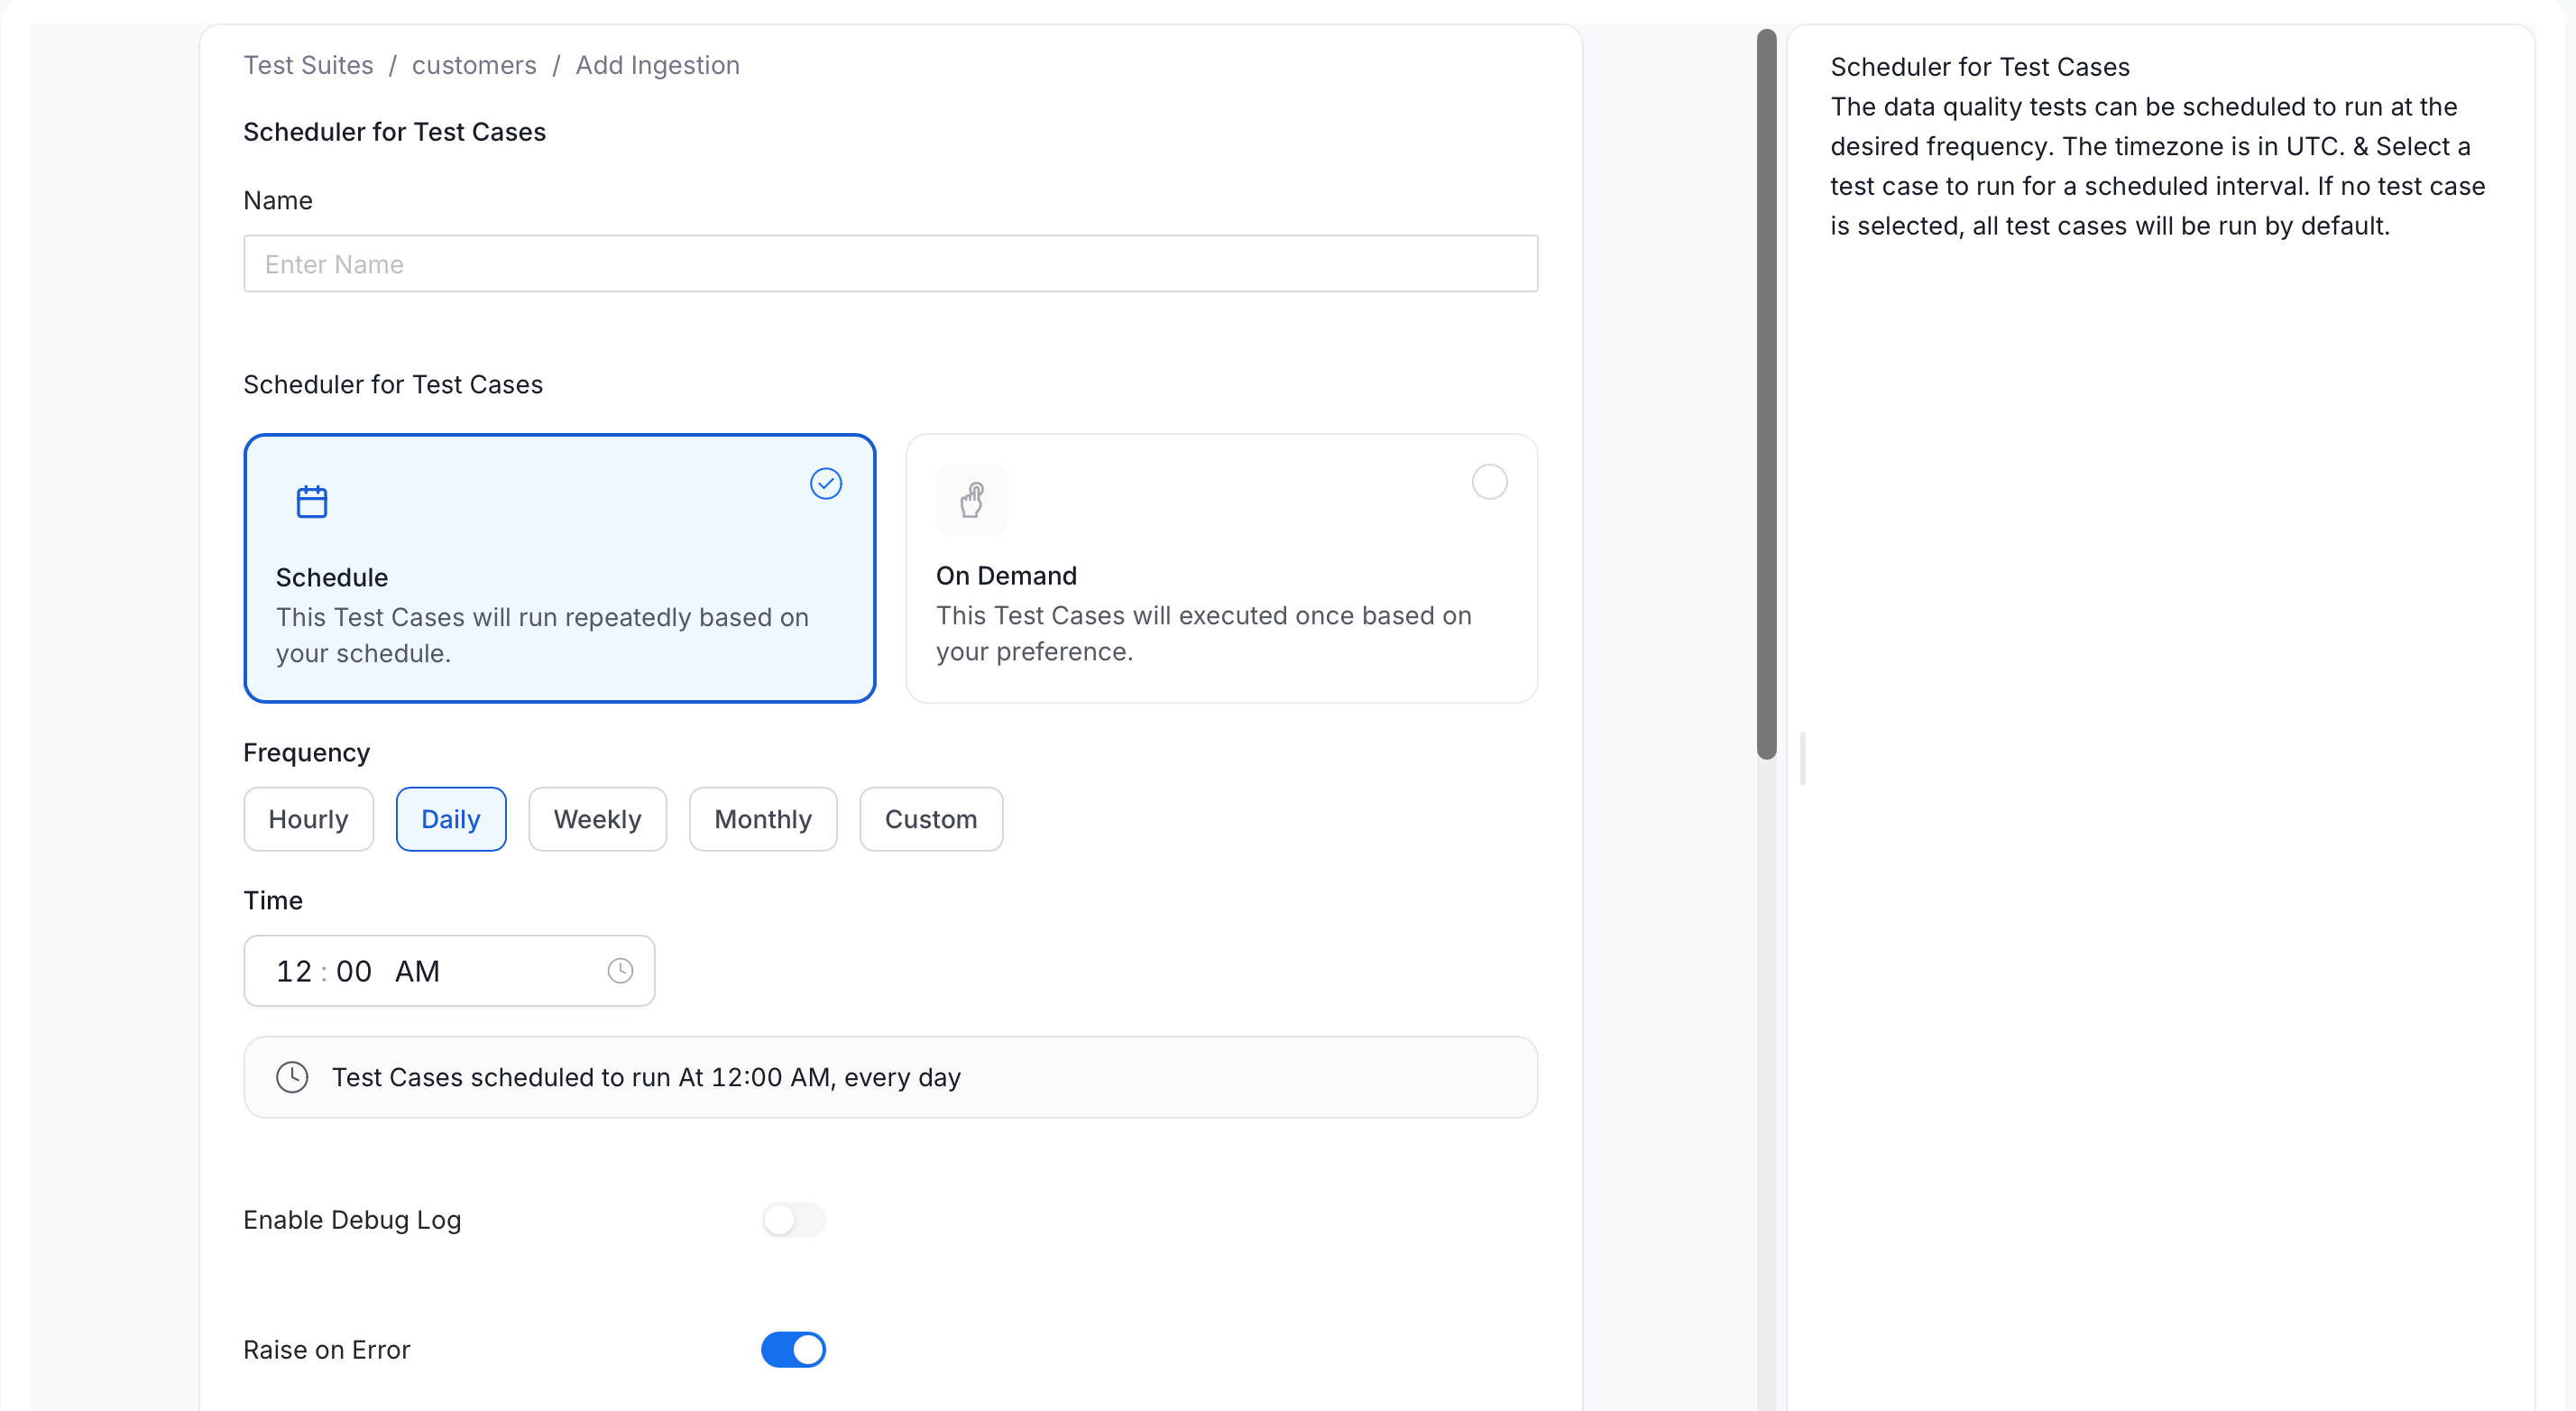
- Click Add Pipeline. The Add Ingestion form opens, titled Scheduler for Test Cases.
- In Name, enter a name for the pipeline.
-
Under Scheduler for Test Cases, choose how the pipeline runs:
- Schedule: the test cases run repeatedly on your schedule.
- On Demand: the test cases run once, when you start them.
- For Schedule, choose a Frequency: Hourly, Daily, Weekly, Monthly, or Custom.
- Set the Time. A line below it summarizes the result, for example “Test Cases scheduled to run At 12:00 AM, every day”. The time zone is UTC.
- Optional: Turn on Enable Debug Log to capture detailed logs.
-
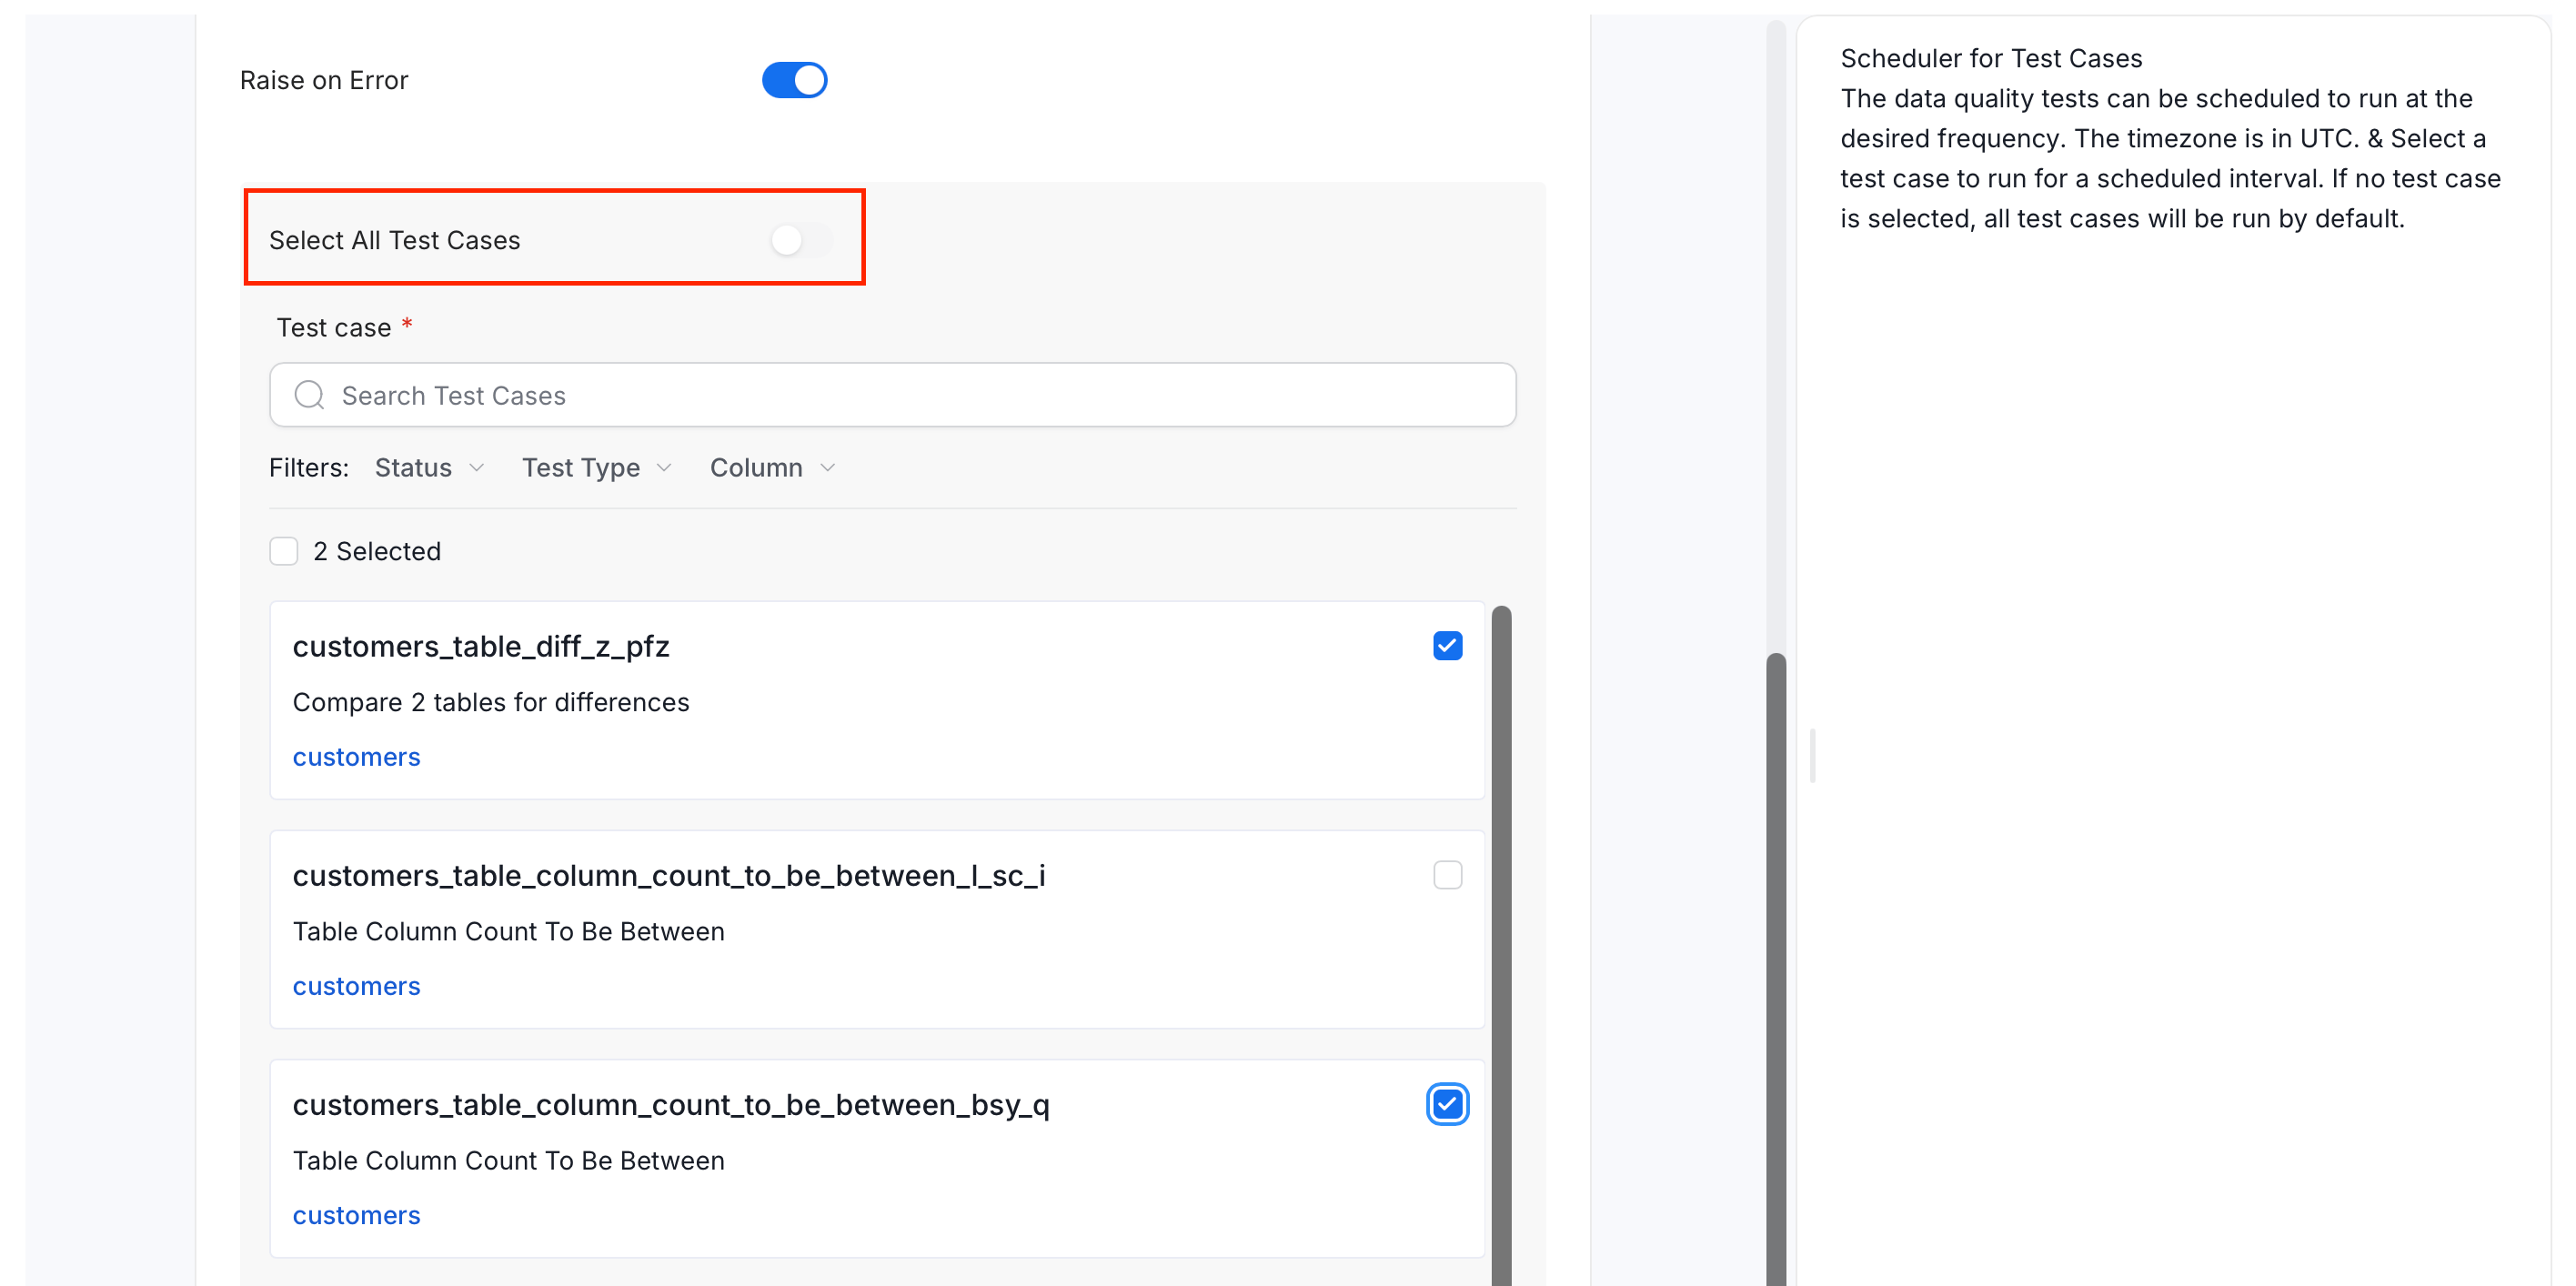
Optional: Turn off Raise on Error, which is on by default and stops the run when an error occurs.
-
Choose the test cases to run:
- Turn on Select All Test Cases to run every test case in the suite.
- Or leave it off and select test cases in the Test case list. Use Search Test Cases and the Status, Test Type, and Column filters to find them. The list shows how many you have selected.
- Click Submit.
Handle Test Failures
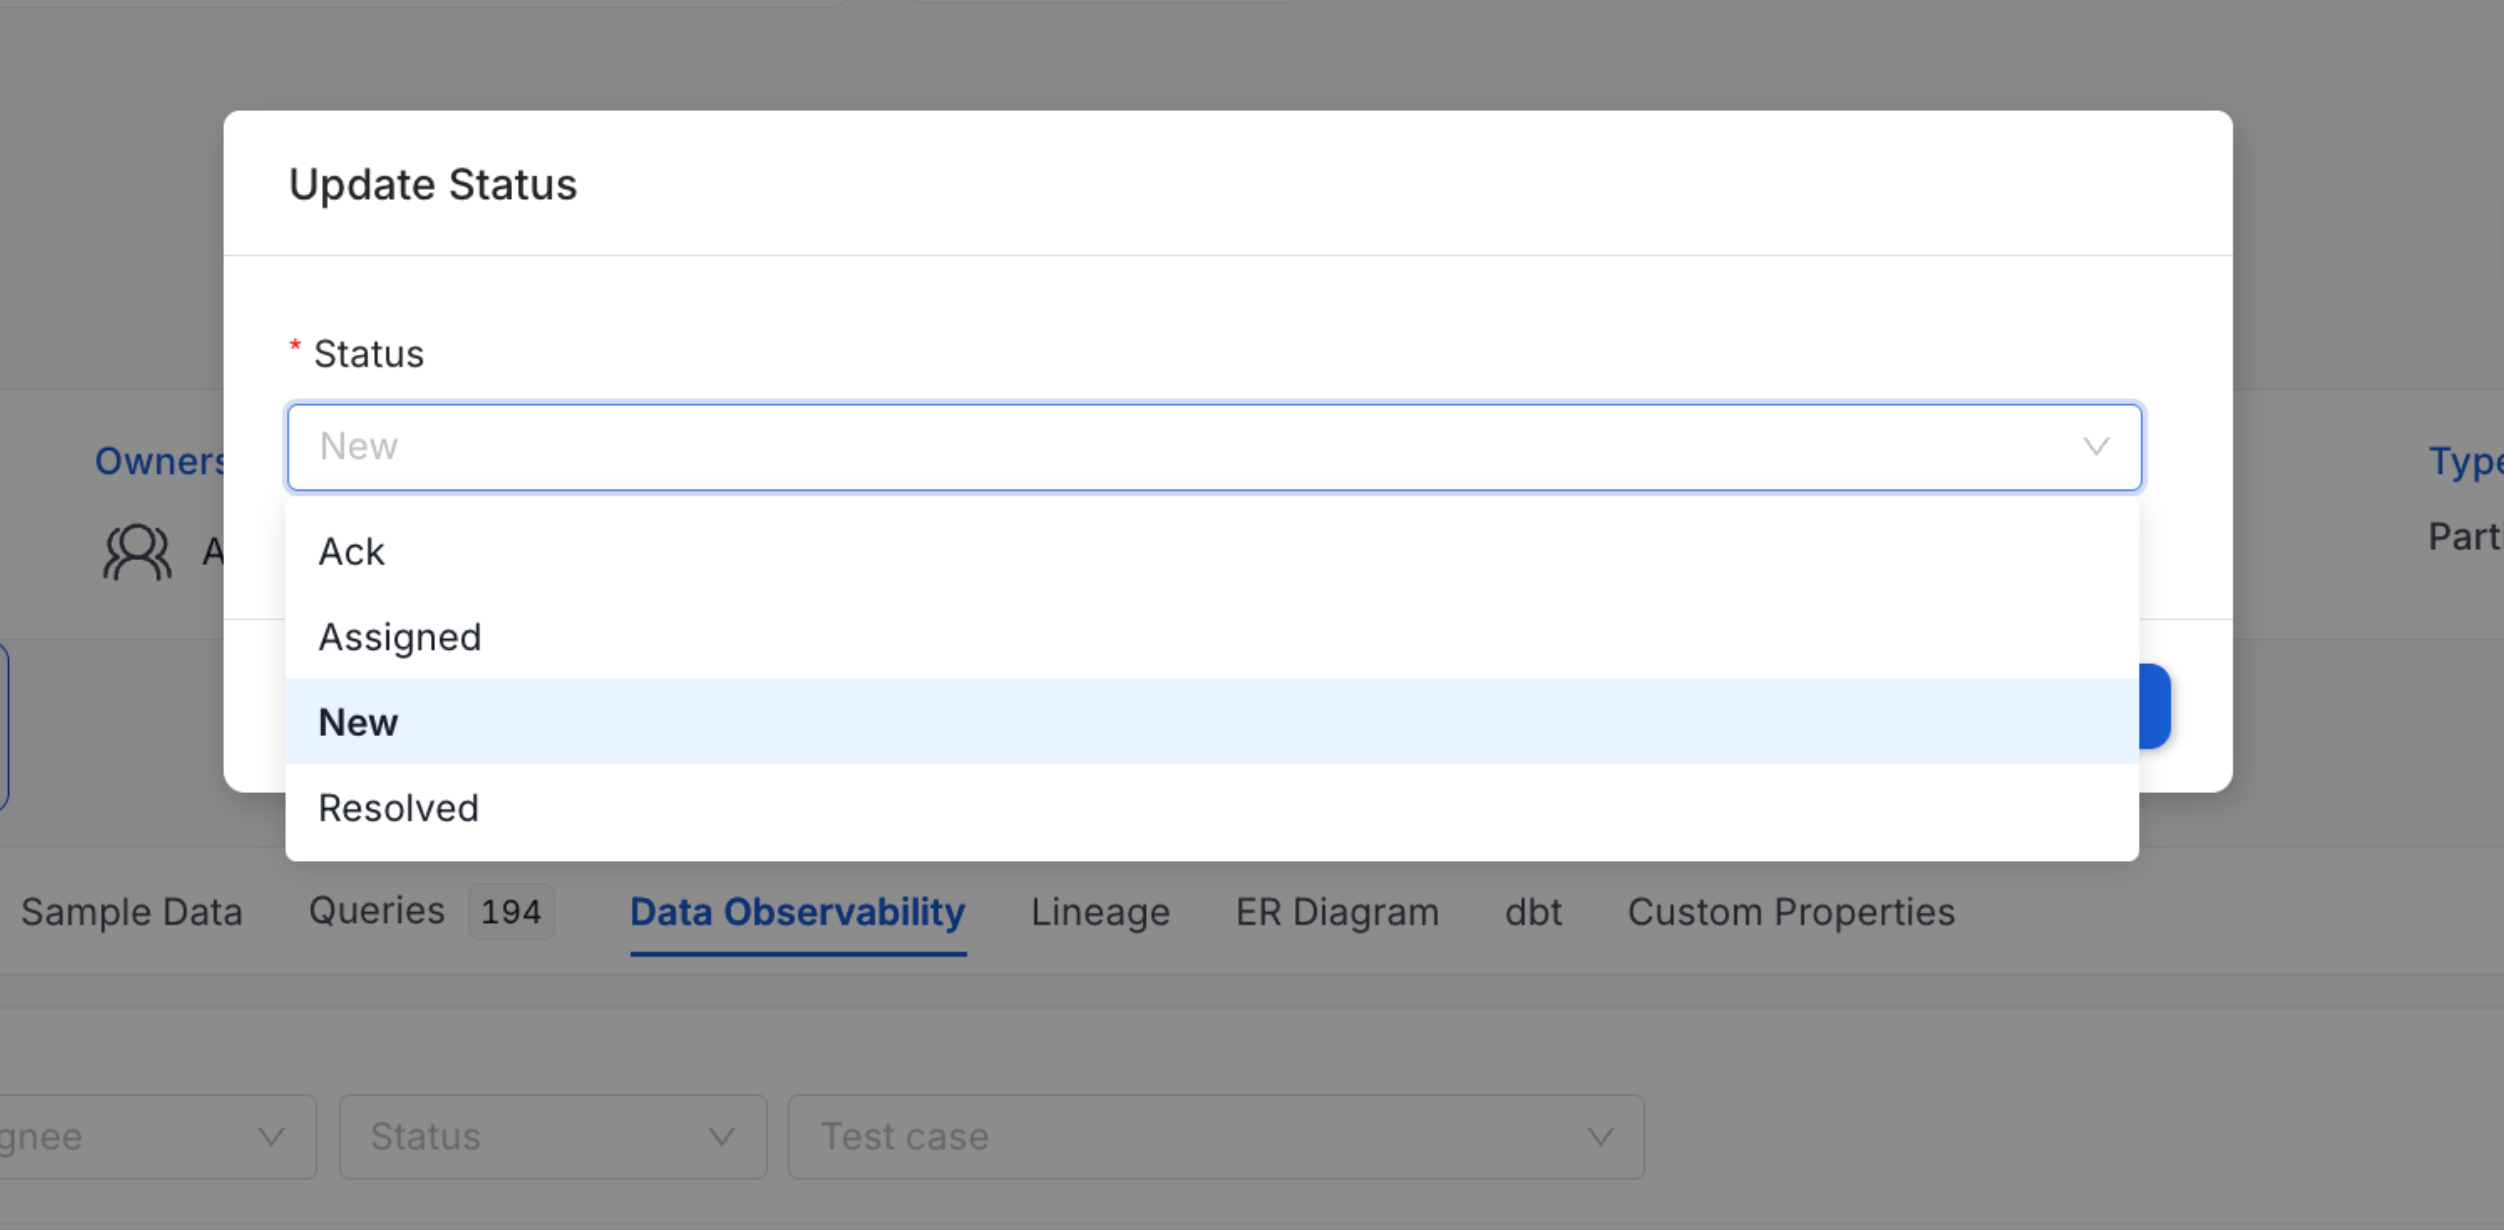
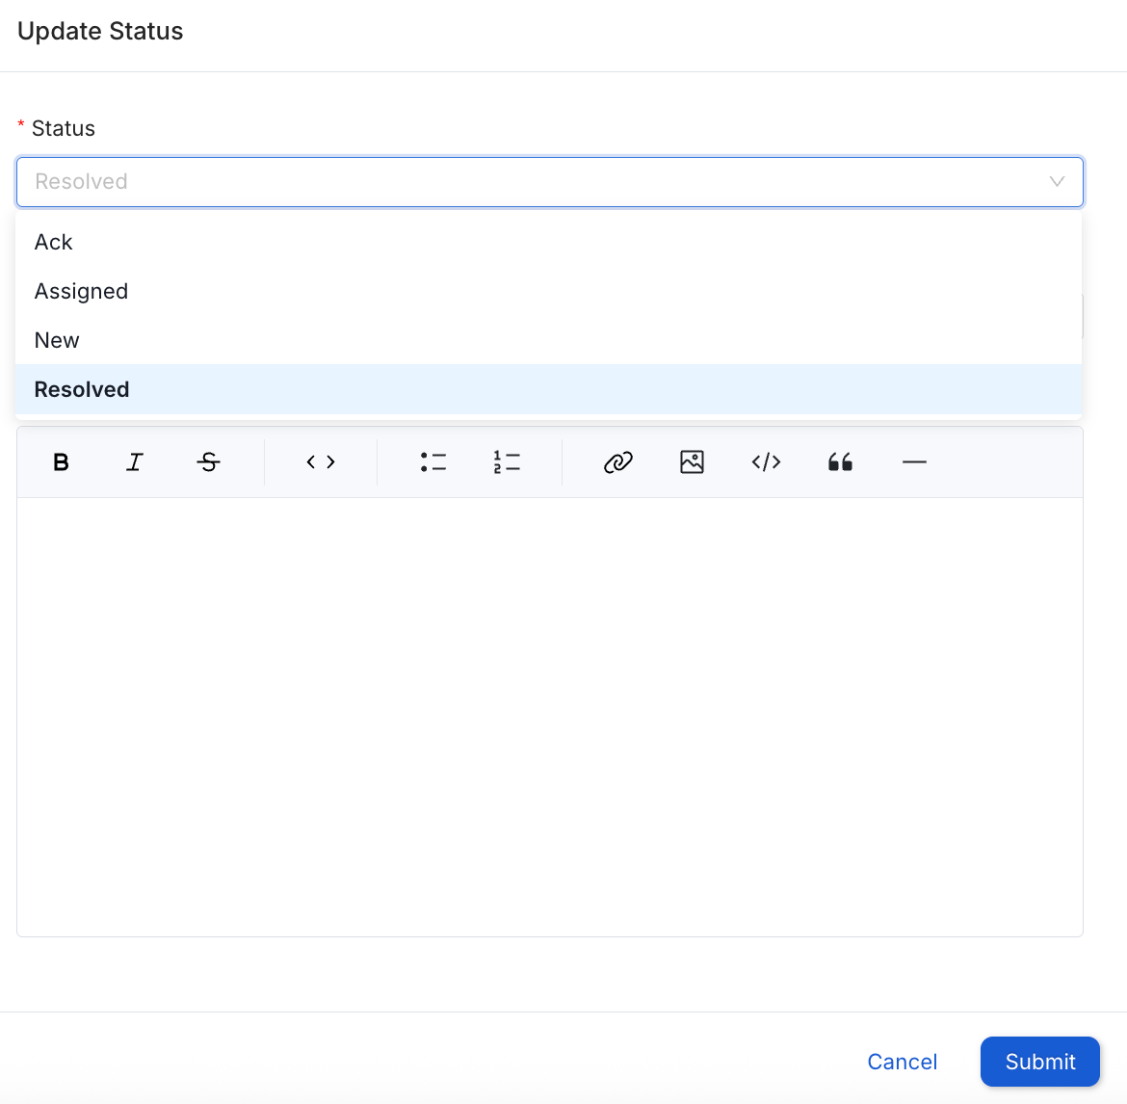
If a test fails, set its status to New, Acknowledged, or Resolved.-
In the Status column, click the status icon of the failed test.

-
Select a test Status.
-
If you mark the test as Resolved, you must give a Reason for the failure and add a Comment. The reasons are Duplicates, False Positive, Missing Data, Other, or Out of Bounds.
- Click Submit.
Delete and Restore a Test Case
Note: Deleting a test case from a table’s own Data Observability tab is a hard delete. Soft delete and restore are only available from the platform-wide Test Cases list described below.
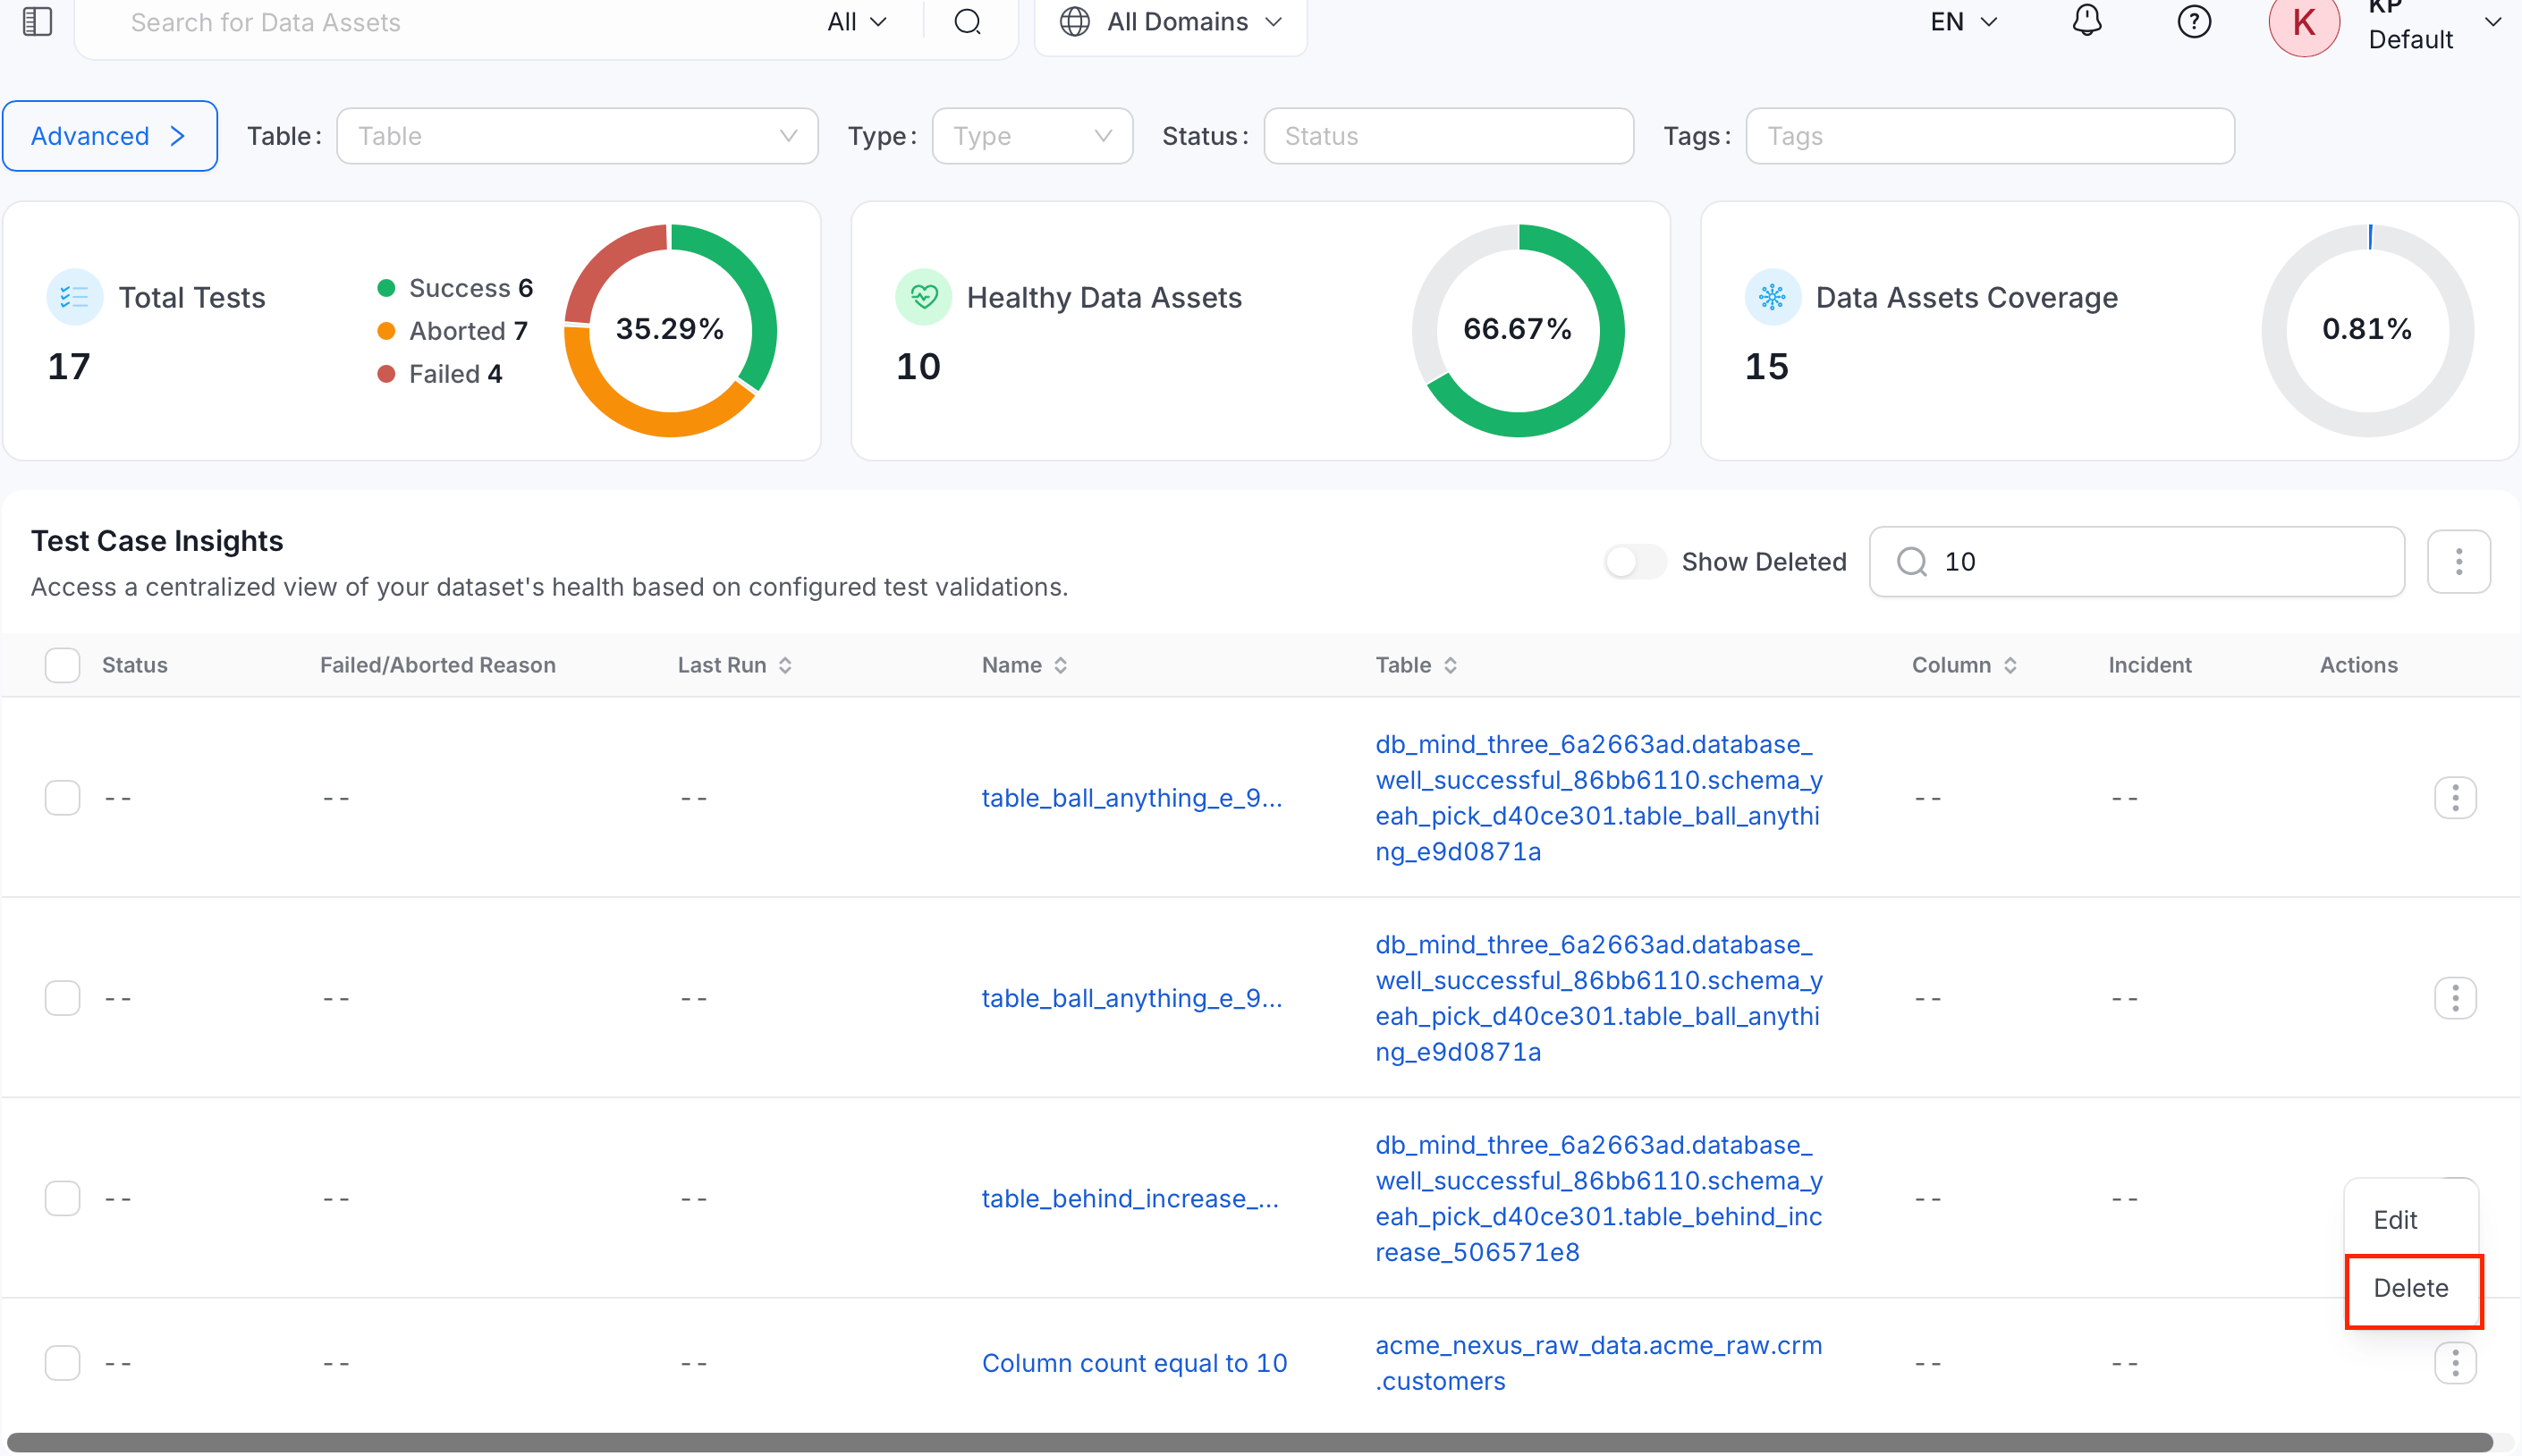
- Navigate to Observability > Data Quality, and click Test Cases.
-
Find the test case and open its row actions menu, then select Delete.
-
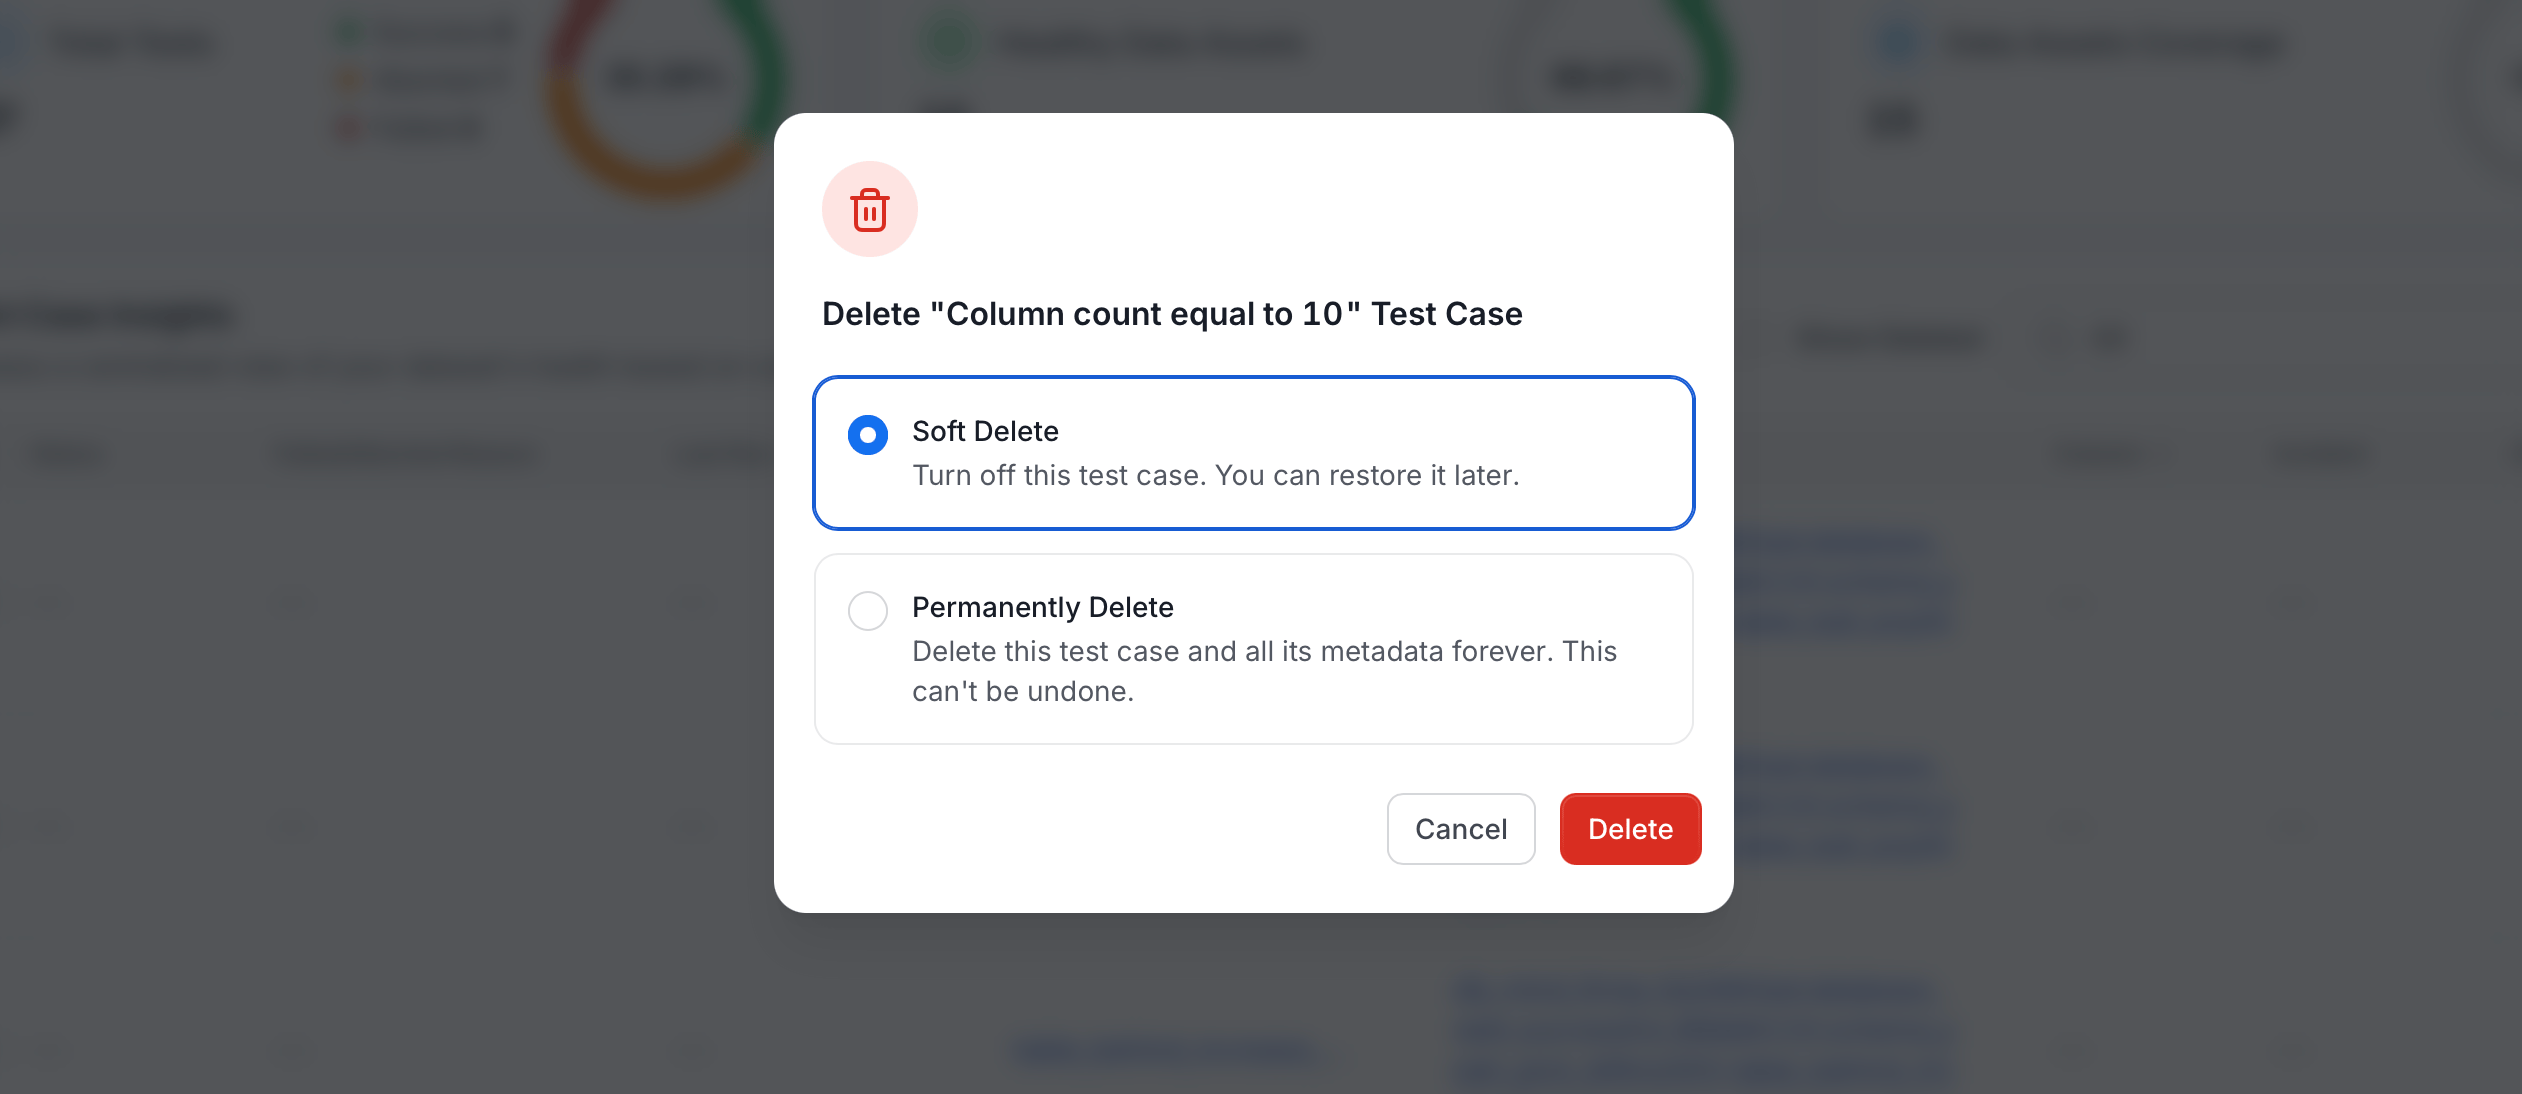
The Delete “<name>” Test Case dialog offers two options:
- Soft Delete (selected by default): Turn off this test case. Restore it later.
- Permanently Delete: Delete this test case and all its metadata forever. This can’t be undone.
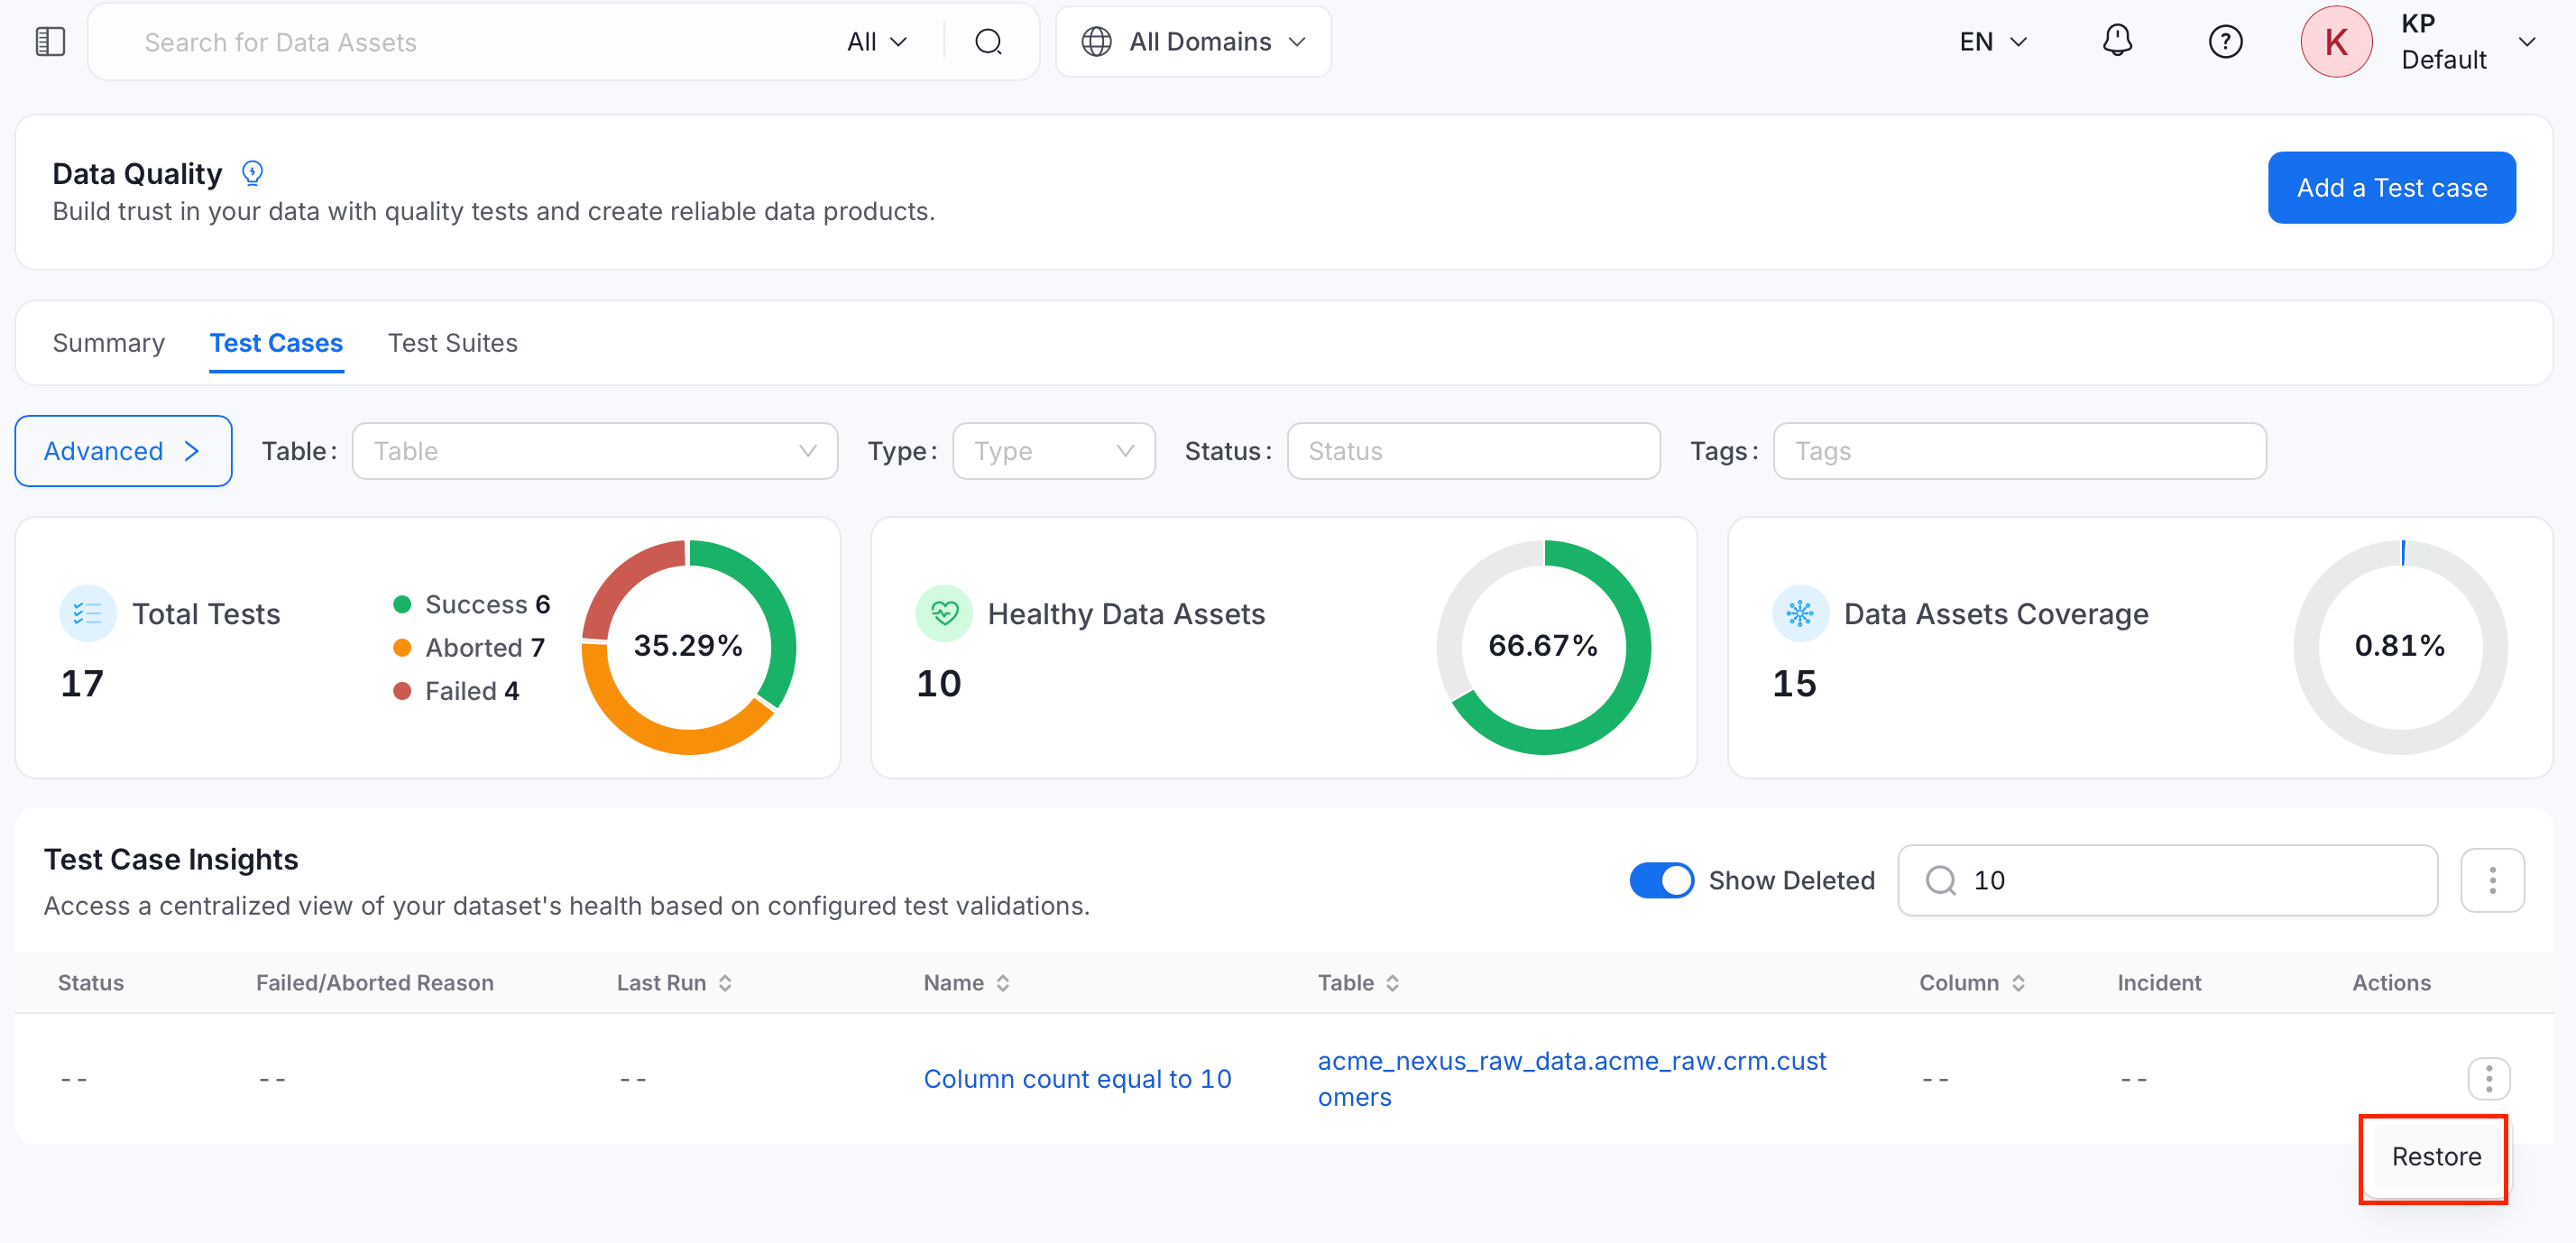
- Toggle Show Deleted on the Test Cases page to find soft-deleted test cases.
-
Open the row actions menu on a deleted test case and select Restore, then confirm. The test case becomes editable and resumes on its existing schedule with its history intact.
Note: Restoring a test case requires EditAll permission on test cases. Also restore a deleted test case from its own details page, which stays read-only until it’s restored.
How to Set Alerts for Test Case Fails
Get notified when a data quality test fails.